July 26, 2017
We have released new KoolReport version 1.34.9. This is small update with some enhancements and bug fixes.

Google Charts
Due to the change in loading Google Chart library, some of the charts such as GeoChart, Sankey, Organization failed to initiate. In this version, we have fixed this issue. If you used one of those charts please update. Other charts are still working well.
ArrayDataSource
In this version, we have added load() function to ArrayDataSource. Now you may use this load() to load array in setup() function of KoolReport. Previously the array data for ArrayDataSource must be input into the settings. The problem arises when settings() function is called multiple times and increases the memory usage unnecessarily. With this update, this happens no more.
function setup()
{
    $this->src('array_source')
    ->load(array(
        array("id"=>1,"name"=>"John"),
        array("id"=>2,"name"=>"Marry"),
    ))
    ->pipe(...)
    ...
}
Still you can insert the array data into $params of KoolReport and use the load() function to load: $this->src('array_source')->load($this->params["mydata"]).
Setting formatValue in Table
When using the koolreport\widgets\koolphp\Table, we can format the value just by set the column type and other settings. However, in some special case, we need more advanced format for value, we can use the formatValue settings. The formatValue can be string or function. For example:
<?php
Table::create(array(
    "columns"=>array(
        "column1"=>array(
            "formatValue"=>"$ @value",
        ),
        "column2"=>array(
            "formatValue"=>function($value)
            {
                return '$ '.$value;
            }
        )
    )
));
?>
Setting {others} in Table
<?php
Table::create(array(
    "columns"=>array(
        "city",
        "{others}"=>array(
            "type"=>"number",
            "prefix"=>"$ ",
        )
    )
));
?>
Above code means that we add the city column in front and the rest of columns are formatted with currency settings.
Summary
Overall, through a series of updates, KoolReport has become stable and reliable in production stage. We are working hard to make KoolReport the best reporting framework you can find there.
<3 koolreport team
July 19, 2017
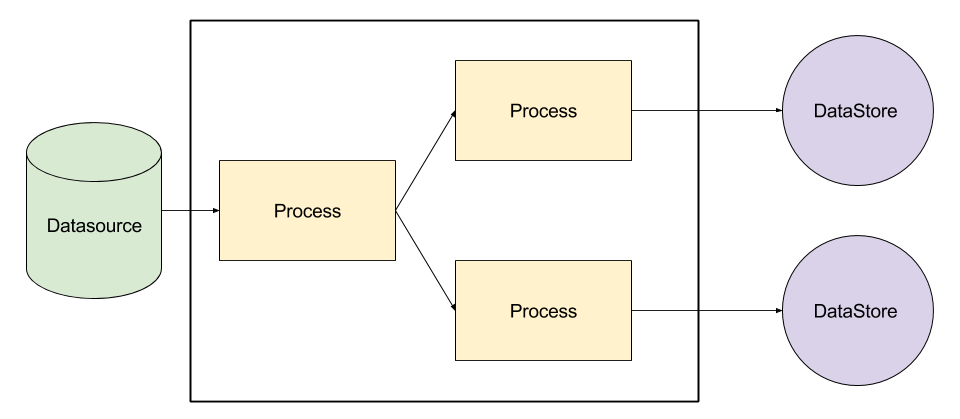
In this article, I would like to explain the data flow in KoolReport. Basically, data flow is like flow of water starting from data sources running through pipes to series of processing points until they reaches the data stores as final destination. The processing point will modify data as data pass through it.
Simple data flow

Above is the most basic flow of data, very straight-foward.
Example
$this->src('automaker')
->query("select * from orders")
->pipe(new Sort(array(
    "shipped_date"=>"desc",
)))
->pipe(new Limit(array(50)))
->pipe($this->dataStore("recent_shipped_orders"));
Branching data flow

The data from the source will be branched to different processes and stored in separate dataStores.
Example
$this->src('automaker')
->query("select * from orders")
->pipe(new Sort(array(
    "ordered_date"=>"desc",
)))
->saveTo($node);

$node->pipe(new Limit(array(50)))
->pipe($this->dataStore("recent_orders"));

$node->pipe(new Group(array(
    "by"=>"customerNumber",
    "sum"=>"amount"
)))
->pipe($this->dataStore("sale_by_customer"));
In above code, you see that we get all data from orders table of automaker datasource. Then we pipe to Sort process to sort data by ordered_date. Now the branching begins. We save the current position of pipe to $node variable for later used. The first branch is through Limit process to get only 50 first orders and save them to "recent_orders" data source. Now, the second branch starts from $node which is the Sort process, we pipe to Group to group data by customerNumber and sum the order amount. We pipe results to "sale_by_customer" data store.
Union data flow

Many times, our data is scattered in various sources and we want to bring them together to process. For example, you have orders of year 2016 in 2016_database and orders of years 2017 in 2017_database. How you can bring them together.
Example
$this->src('2016_database')
->query("select * from orders")
->saveTo($node);

$this->src('2017_database')
->query("select * from orders")
->pipe($node);

$node->pipe($this->dataStore("total_2016_and_2017_orders"));
As you can see in above code, orders in year 2016 is saved to $node. Then the orders of year 2017 are also piped to $node. After that, the $node will pipe data to "total_2016_and_2017_orders" data store.
Hope that the article helps you to understand the data flow in KoolReport.
<3 koolreport team
July 6, 2017
Time to meet up and party again. We have released KoolReport v.1.32.8 and a very essential package called Inputs.

In this new version of KoolReport we have several important updates:
First, PDODataSource is now able to bind parameters to SQL Query as we understand that mixing query with parameter is looking bad. Here comes example:
function setup()
{
    $this->src('sale_database')
    ->query("
        SELECT *
        FROM tbl_orders
        WHERE
            orderDate > :startDate
            AND
            orderDate< :endDate
    ")
    ->params(array(
        ":startDate"=>$this->params["startDate"],
        ":endDate"=>$this->params["endDate"],
    ))
}
Second, the \koolreport\koolphp\Table has been able to set 'align' for each columns. Although this can be done through setting css class for column in previous version, it is handy to set directly to the column settings.
<?php
Table::create(array(
    ...
    "columns"=>array(
        "price"=>array(
            "align"=>"right"
        )
    )
));
?>
Third, we have fixed the errors of missing row in ColumnsSort and also created a new process called Map which is very versatile to transform data.
Please go to our website to acquire new version of KoolReport.
Save the best for last, the Inputs package, your simplest way to create a dynamic report.
From the beginning, report created on KoolReport is able to receive parameters. We can create our own form and transmit values from form to report to make it dynamic. However, the process is quite tedious. It requires us to create form and inputs controls and make them persistent to the state of user's input. That is the reason, we create Input package to simplify those tasks.
The Input package features:
- Containing common inputs: TextBox, CheckBoxList, RadioList, Select, MultiSelect, DateRangePicker and DateTimePicker.
- Input controls are able to bind to data to render
- State of input are persistent through POST/GET and in sync with report's parameters.
Here are two short demos:
- List of all input controls
- Order Listing example using input controls
The package is Totally Free.
Thank you for your time to keep update with our work.
<3 koolreport team
June 7, 2017
Yeahhh! Party again in just 20 days! We just want to let you know that we have released new version 1.27.6. This version contains very important updates such as: ability to theme report, supporting old database connections, sorting columns by name or label.

Theme your report
One of the most requested features that we received from our users is the ability to theme or style a report. A theme sets a report a consistent font, colors of chart, spacing and etc. As a result, we will have different look and feel for our report just by changing the one themes to another. In this new version, we can use a theme simple as below code:
<?php
class MyReport extends \koolreport\KoolReport
{
    use \koolreport\bluesea\BlueSeaTheme;
}
Although in this version, KoolReport is able to theme a report but we are still working on a theme to release. There is no theme demo right now but it will be soon. We will keep you update.
Support old database connection
Since the first version of KoolReport, we support the use of PDODataSource to connect to most common databases such as MySQL,SQL Server, Oracle and others. PDO has become standard of database connection. However, some of our users still request the old database connection. So we have added first two classes MySQLDataSource and SQLSRVDataSource to help to connect the most used databases.
Sort columns by name or labels
We have provided a new process called ColumnsSort which help to sort your list of columns in correct order. This process can be used after Cube or Pivot process to re-order the columns generated by them.
Some other minor updates
- Fix the initiation of Google Chart widgets, this fix is due to the change in google chart library.
- Move
ExcelDataSource and MongoDataSource to separated packages. This will help to reduce the size of core packages. The packages for excel and mongodb will be distributed free under MIT License.
- Add
debug() function to KoolReport so that we can see the all data available before creating view.
Sort process now can sort data by custom comparison function.
The full updates list can be found here.
If you have any questions or comments on this new version, please go to this forum thread. All comments, good or bad, are welcome.
Thank you very much.
<3 koolreport team
June 2, 2017
KoolReport is a poweful PHP Framework for reporting. It can be a sale report for printing. It can be a dashboard to centralize information. And it can be a business intelligent tool to support management decision. It is you who decide what KoolReport will be.

There are three terms that people used to confuse: reporting, dashboard, business intelligence. Reporting normally is related to summarize the past information, analyze data to come up with good information of what happened ex. last year sale report. When we talk about dashboard, we talk about what is going on right now , the data is gathered from many sources and presented to you in an interactive format of charts and tables. Different from others two, business intelligence is working toward future. Data from the past are also gathered and analyzed but not only for purpose of reporting but predicting the incoming future. Business intelligence tool uses past data to discover pattern and use them to guess what may happen. In sum, reporting is for the past, dashboard is present and business intelligence is the for future.
KoolReport can be your reporting tools, dashboard or a business intelligence tool.
KoolReport can be your reporting tool. By getting sale data in the past and perform aggregation, it will form a nice printing report with beautiful charts and graphs.
KoolReport can act like a dashboard tool because it allow you to gather data from various sources: MySQL, CSV, Excel and from Google Adwords, Analytics, Salesforce etc.. and let you know what is going on with your business.
KoolReport also can be business intelligence tool. In near future, we want to have packages to perform regression and prediction. Your past data will be used to train model and KoolReport will give you predicted data visualized in tables or charts. That will be amazing.
Thanks for reading. It is just a thought of us about what KoolReport is, what future it can be and will be.
Please try KoolReport and if you like it please share with others.
<3 koolreport team.


