September 23, 2024
We’re thrilled to announce the latest release of KoolReport and its packages! This update brings brand new features, improvements, and important fixes across multiple components to enhance your data reporting and dashboard-building experience.
KoolReport Core 6.6.0
- New powerful operators for filtering: "like", "not like", "betweenInclusive", and "notBetweenInclusive".
- Fixed MySQLDataSource parameter binding issues in certain cases.
- Enhanced security with the new
jsonRender property for CSP compliance (no more unsafe-eval!).
ChartJS 3.3.0
- Fixes for better control over
borderColor and backgroundColor options.
- Added
jsonRender property for stronger security with CSP compliance.
Dashboard 4.8.0
- Improved FileUploader with error message handling and a waiting icon during uploads.
- New
response() method added to the Application for full dashboard element access and extra response functionality.
- Added
jsonRender for CSP compliance to keep your projects safe.
ApexCharts 1.1.0
- HeatMapChart improvements with accurate colorScale ranges and legend names.
- Handy helper functions for seamless data conversion before chart rendering.
- Enhanced security with the
jsonRender property.
D3 1.7.0
- Now includes
jsonRender property for better CSP compliance and security.
Pivot 9.2.0
- PivotMatrix now supports serverPaging, working with PivotSQL for smoother large data handling.
jsonRender property added for safer rendering.
Inputs 6.5.0
- New DateTimePicker2 with Bootstrap5 compatibility for an even smoother experience!
- Added "bs4" themeBase for BSelect and DateTimePicker.
These updates make it easier and safer to build your reports and dashboards with KoolReport. Whether you’re developing advanced analytics, visualizing data, or managing inputs, we’ve got you covered with the latest enhancements!
Upgrade now to take advantage of these exciting new features and improvements. Let’s keep pushing the limits of data reporting together!
Happy Reporting!
<3 koolreport team
October 18, 2023
In the ever-evolving world of data-driven decision-making, data visualization plays a pivotal role. It transforms raw data into meaningful insights and empowers businesses and developers to make informed choices. Today, we're thrilled to introduce the seamless integration of ApexCharts with KoolReport, opening up a world of possibilities for developers and businesses seeking advanced data visualization solutions.

The fusion of KoolReport, a robust PHP framework specializing in data reporting, and ApexCharts, a powerful JavaScript charting library, marks a significant leap forward in the realm of data visualization.
A Dynamic Duo: KoolReport and ApexCharts
KoolReport has long been a trusted ally for developers in the realm of data reporting. Its ease of use, flexibility, and extensive feature set have made it a go-to solution for generating insightful reports and dashboards directly from data sources like databases. Now, with the integration of ApexCharts, KoolReport takes data visualization to the next level.
ApexCharts, as a versatile JavaScript charting library, offers an impressive range of chart types, interactivity options, and customization features. Whether you need to create compelling line charts, interactive bar graphs, insightful pie charts, or any other data visualization, ApexCharts delivers. The seamless integration of ApexCharts into KoolReport extends the framework's capabilities, allowing you to harness the full potential of both tools in tandem.
Why This Integration Matters
- Enhanced Data Presentation: With ApexCharts at your disposal, you can transform your data into stunning, interactive visualizations that are both aesthetically pleasing and informative. It's the key to presenting data in a way that resonates with your audience.
- Simplified Development: Developers often face the challenge of creating complex data visualizations from scratch. With the integration of ApexCharts into KoolReport, this process is simplified, allowing for faster development and reduced coding effort.
- Customization: ApexCharts is renowned for its flexibility. You can customize your charts to fit the unique requirements of your project. Whether it's adjusting colors, styles, or interactivity features, the power is in your hands.
- Interactivity: Interactive charts engage users, enabling them to explore and gain deeper insights into the data. ApexCharts facilitates the addition of features like tooltips, zooming, and data filtering, making your charts come to life.
- Consistency and Uniformity: The integration ensures a seamless experience within KoolReport. The charts blend effortlessly with your reporting framework, maintaining a consistent and professional look throughout your reports and dashboards.
Getting Started with ApexCharts in KoolReport
Getting started with ApexCharts in KoolReport is a breeze. The integration is designed to be developer-friendly and intuitive. You can easily create and configure your charts directly from your PHP code. No need to delve into complex JavaScript coding or deal with time-consuming client-side processes. Here's a glimpse of how straightforward it can be:
<?php
\koolreport\apexcharts\DonutChart::create(array(
        "dataSource" => [
           ['value'],
           [44],
           [55],
           [41],
           [17],
           [15]
        ],
        "columns" => [
            "value"
        ],
        "options" => [],
        "showLabel" => true,
        "maxWidth" => "450px",
    ));
?>
This simple code snippet demonstrates how you can create a donut/pie chart using ApexCharts within KoolReport. You can customize chart types, data, and various options to tailor your visualizations precisely to your needs.
View this example on KoolReport demo
Elevate Your Data Visualization
The integration of ApexCharts with KoolReport opens up a world of opportunities for developers, businesses, and data enthusiasts. Whether you're looking to create impactful reports, dynamic dashboards, or engaging presentations, this powerful combination empowers you to take your data visualization to new heights.
With the fusion of KoolReport's data reporting prowess and ApexCharts' rich charting capabilities, you can effortlessly transform your data into insights that drive informed decisions. So, embrace the future of data visualization with ApexCharts and KoolReport and experience the magic of turning data into knowledge.
Elevate your data visualization game, explore the endless possibilities, and unlock the true potential of your data.
July 4, 2023
As a budding developer, you may find yourself grappling with the intricacies of visualizing data from databases like MySQL in captivating charts and graphs. Fear not, for I am here to guide you through the process with the help of KoolReport—a powerful PHP framework that will revolutionize your data visualization journey and simplify your development workflow.
Traditionally, achieving data visualization involved a series of complex steps. You would need to harness the power of PHP to query your database, transform the retrieved data into the specific format required by the chosen charting library, export it as JSON, and then write client-side JavaScript code to render the charts. This process not only consumed a significant amount of time but also presented challenges when switching between different charting libraries.
References:
- AnyChart: Connecting MySQL Database to JS Chart Using PHP
- FusionChart: Create Interactive Charts using PHP and MySQL Database
- Learning Programming: Google Chart with PHP and MySQL
But behold! KoolReport is about to unveil a new world of data visualization simplicity. Developed with a laser focus on data reporting, this framework will enable you to effortlessly create visually stunning charts directly from your database, eliminating the need for tedious and error-prone transformation processes. Allow me to guide you through an example that showcases the elegance and power of KoolReport.
Imagine you wish to create a column chart to visualize the spending amount of each customer in your MySQL database. With KoolReport, accomplishing this becomes a breeze. Let's dive into the code:
<?php
use \koolreport\datasources\PdoDataSource;
use \koolreport\widgets\google\ColumnChart;

// Database connection information
$connection = array(
    "connectionString" => "mysql:host=localhost;dbname=sales",
    "username" => "root",
    "password" => "",
    "charset" => "utf8"
);

// Create a column chart to visualize the spending amount of each customer.
ColumnChart::create([
    "dataSource" => (new PdoDataSource($connection))->query("
        SELECT customerName, SUM(amount) as total
        FROM orders
        GROUP BY customerName
    ")
]);
Impressive, isn't it? With just a few lines of code, you establish a connection to your MySQL database, retrieve the desired data, and generate a beautiful column chart displaying the spending amount for each customer. The simplicity and efficiency of KoolReport allow you to focus on the bigger picture rather than being tangled in cumbersome technicalities.
Moreover, KoolReport offers a diverse range of chart types to cater to your specific needs. From fundamental line charts and bar charts to intricate pie charts, area charts, geo charts, gauge charts, histograms, and combo charts, you have the freedom to unleash the full potential of your data.
What truly sets KoolReport apart is its seamless integration with multiple charting libraries. Whether you prefer Google Charts, ChartJS, Morris Chart, D3, or new player ApexCharts, KoolReport has you covered. Thanks to its common API, transitioning between charting libraries is effortless. By merely changing the chart class, you can explore different visualization options without wasting precious time rewriting your entire transformation process.
In summary, as an aspiring developer, you now possess a powerful tool—KoolReport—to simplify your data visualization endeavors. This framework empowers you to streamline your development process, save invaluable time, and focus on creating impactful data visualizations. Say goodbye to convoluted data transformations and embrace a world where charting becomes an intuitive and seamless experience. With KoolReport by your side, you can elevate your data visualization skills and unlock a realm of possibilities.
April 7, 2023
We are thrilled to announce a major release of KoolReport products with significant improvements. Upgrade is highly recommended.

Compatibility with PHP 8.2
Dynamic properties have been deprecated in PHP 8.2 causing issues for KoolReport and its packages. We have completely solved the issues with dynamic properties in this release, enabling you to upgrade to the latest PHP confidently.
KoolReport Core 6.1.0
Improvements have been made to Table, Google Chart and the ability to store the view folder in a separate folder. The view file of a report no longer needs to be in the same folder as the report’s class file.
Dashboard Framework
Exporting capabilities have been greatly enhanced with the addition of a general engine() method. This method enables you to specify a list of exporting engines that you need and choose which engine to use during the exporting process. Excel exporting has also been improved, allowing developers to customize the view of the excel file instead of using the default view from the previous version.
Other packages
- Datagrid 7.8.0: Ability to load custom css file
- Excel 10.6.0: Excellent improvement for MacOS Number compatibility and ability to rearrange widgets automatically in Excel files
- Export 5.3.0: Improve the flexibility of export view by adding viewMap property.
- VisualQuery 2.1.0: Fix the grouping when multiple fields are used
- Amazing 2.1.4: Fix FormDropDown and DonutChart in Dashboard
- AppStack 1.1.5: Fix FormDropDown and DonutChart
- Bootstrap4 1.5.1: Upgrade to 4.5
- ChartJS 3.2.1: Minor fix
- ChartTable 1.3.1: Minor fix
- Cleandata 1.6.1 :Minor fix
- CloudExport 4.2.0: Upgrade php client library
- Cube 3.5.1: Minor fix
- Inputs 6.5.1: Minor fix
- MorrisChart 3.0.1: Minor fix
We hope that you enjoy the new releases.
<3 koolreport team
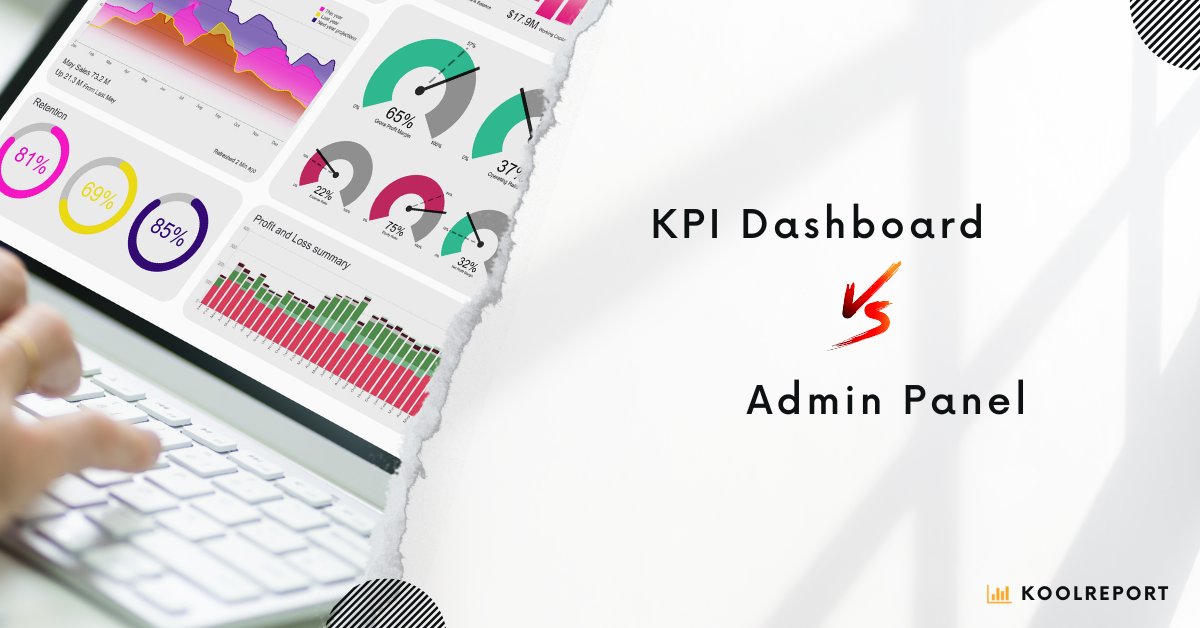
February 25, 2023
You might wondering What are the differences between Dashboard and Admin Panel? What should you choose for your project?
As businesses grow, so does the amount of data they generate. It becomes increasingly important to collect, organize and analyze this data to make informed decisions. This is where dashboards and admin panels come in.
Both dashboards and admin panels are tools used to manage and analyze data, but they serve different purposes. An admin panel is typically used by an organization's internal team to manage the backend of a website or application. It provides access to the data and tools necessary to manage the functionality and content of the site.
On the other hand, a dashboard is a user interface that provides an overview of important metrics and key performance indicators (KPIs) for a business. It is designed to help stakeholders make quick, informed decisions based on real-time data.
While these two tools may seem similar, they serve distinct purposes. An admin panel is focused on managing and updating a website or application, while a dashboard is focused on presenting data and insights.
However, what if you could have a tool that combines both the functionality of an admin panel and a dashboard? That's where the Dashboard Framework of KoolReport comes in.
Built on top of the powerful KoolReport Pro, the Dashboard Framework is a set of ready-made features designed to make it easy for developers to create online dashboard applications or admin panels for websites. With just a few lines of code, developers can create a modern, single-page dashboard that includes built-in authentication, authorization, and support for multiple databases and data sources, including CSV and Excel files.
In addition, the Dashboard Framework includes support for multi-languages and multi-themes, making it easy to create custom dashboards that fit your brand and language preferences. And with widget lazy loading support, developers can ensure that the dashboard is fast and responsive, even when working with large datasets.
The Dashboard Framework is also flexible and can work within other popular PHP frameworks, including Laravel, CodeIgniter, Yii2, and Symfony. This makes it easy to integrate the Dashboard Framework into your existing workflow and start building great dashboard systems for your clients or your own business.
View Dashboard Framework Demo
In conclusion, while dashboards and admin panels serve distinct purposes, the Dashboard Framework of KoolReport makes it easy to create a tool that covers both functionalities. With its powerful features and flexible integration options, the Dashboard Framework is a valuable tool for any developer looking to build a modern, data-driven application.