December 25, 2021
Reporting section is always a part of any system, sometimes it plays a crucial part. We have learnt this through hundreds of projects we did for our customers. So what is KoolReport and why you should consider having it in your great php application.
What is KoolReport?
By definition, KoolReport is an intuitive and flexible open-source PHP Reporting Framework for faster and easier data report delivery. Just like any php framework like Laravel or CodeIgniter, KoolReport provides developers a frame to code, a list of ready-made functionalities to build things. While other frameworks focus on constructing web applications, KoolReport only focuses on one thing: using PHP to construct great data reports.
Koolreport was born from the fact that data reports appear very often in almost all web applications. It is understandable because we always need to know the status of applications such as number of visitors, number of registered users or number of item sales and so on. We have built several hundred applications for our customers and 90% have report sections. In some of them, the report section is actually the main part. This is the biggest motivation for us to construct KoolReport in the first place.
There are 5 reasons that you would like to have KoolReport in your projects:
Easy
Easy to install and easy to use. You can install KoolReport by either downloading a copy and putting it inside your application or by using composer with a single command line. The structure of a report is very simple, one php class for report’s definition and one view file for report’s visualization. That’s why you can start using KoolReport in almost no-time.
Single purpose
KoolReport only does one thing and only one thing: building a good data report. Nothing more. You will not see routing, authentication or whatsoever. Is it bad? It depends on each opinion but for us, doing one thing best is better. “Make a good report” is not a simple task in fact. It includes 3 things.
First is the ability to connect to various sources and bring in data in one place. A report could be combined results from different data sources, a little from MySQL, some in Postgresql and other from CSV.
Second is the power of data processing. Data is gathered but how to fastly combine and transform them into meaningful information is the question. KoolReport contains over 30 built-in data processes which you can use with your data.
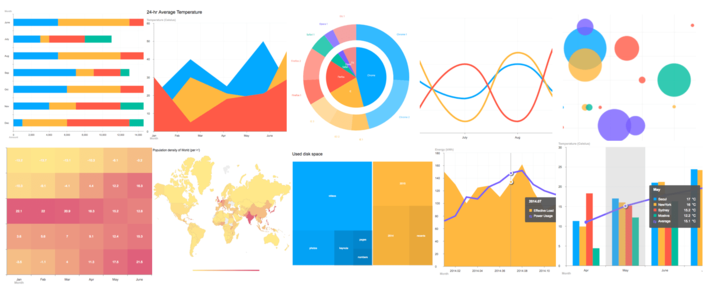
Last is data visualization capability. We have all meaningful data but without a good representation, the story could not be told. KoolReport is integrated with rich charts and graphs that come from well known libraries such as Google Chart, D3 or ChartJs for you to convey your data in the most impressive and interactive way.
Work with different environments
KoolReport can be integrated into Laravel or CodeIgniter or any MVC frameworks out and utilize their functionalities not existing in KoolReport. So KoolReport wants to be part of ecosystems, does one good thing and corporate with others, all heading to a final purpose: A great application.
Inherit experience of data report maker
Our deep experience of making data reports has been put into KoolReport. Moreover, the comments, recommendations and error report from users helps us to perfect KoolReport through many years. So using KoolReport, you are using a proven framework made by experts and growing from real use cases.
Free and open-source
Cost is always a part of the decision as always. KoolReport is released as a free and open-source library under MIT license which virtually gives you full right to use, to access and modify source-code as your own need.
So above are the top 5 reasons that you should use KoolReport inside your project. Of course, any solution has drawbacks and KoolReport will not be an exception. The reasons we give could be biased and the best way is your own experience with the framework.
December 5, 2019
PHP has had better days, for sure. But is it really dead? On a forums like Stack Overflow people are suggesting that PHP is dead. Do they have a valid point, or could it be that they just don’t like PHP? Let’s take a look at PHP and see if there is a future for this programming language.
PHP Is Still Dominating The Web
If you take a simple look at the numbers PHP is definitely not dead. PHP is the most used server-side programming language by far. Approximately 75 percent of all webpages are powered by PHP. It is fair to conclude that PHP isn’t dead based on this statistic since 75 percent is far too high number for a dead language!
One of the reasons that PHP is used by so many websites is because WordPress uses PHP. The market share of WordPress is approximately 34 percent of all websites. That’s 75 million websites using WordPress.
Furthermore, there are some other CMS’s like Drupal (3%) and Joomla(2%) which also have a significant share of the market. And there are some popular shop management systems, like Magento, which have around 1 percent of the total market share.
A lot of big content and shop management systems are using PHP, which makes PHP important and relevant.
Building Websites From Scratch
I can see the argument about building websites from scratch since a lot of people, who use WordPress for example, don’t know how to code. Making a website in WordPress does not require you to know how to code. A lot of people who have a WordPress website probably don’t even know that it’s powered by PHP. So is PHP still used by people who build websites from scratch?
PHP was and still is a very popular language. One of the reasons for this is that it’s a really easy programming language to learn. That makes it an excellent language for people new to building websites. PHP can be learned without any prior knowledge. I think it’s fair to say that most web developers that have been around for a while probably started out with PHP, or at least have worked with PHP at some point.
Programming
Since PHP has been around since 1994 the language has got a little cluttered over time. There are a lot of ways to build the same functionality and a lot of these ways are pretty hacky. This makes it easier to write bad code in PHP. Obviously, it’s possible to write bad code in any language but PHP makes it a little easier because of the way it has grown.
PHP has been around so long it also has a lot of old stuff. This makes it easy to get started with PHP, but if you stick to the old solution you end up with suboptimal code that doesn’t follow best practices. And this is something that you should really try to avoid. Not following the best practice is something that will happen when you’re inexperienced with PHP since it is not always clear what the best solution is. This is because there are a lot of ways to solve the same problem. This is one of the reasons why PHP is hated by some developers.
On the other hand, you could argue that most web developers don’t write raw PHP. Most of the times you will be using some sort of framework that does a lot of things for you. A popular PHP framework that is very clean is Laravel. The advantage of working with a framework is that a lot of the dirty work is done under the hood. The framework forces you into writing cleaner code.
PHP 7
Since the release of PHP 7 a lot of new features and improvements have been introduced. The two most significant improvements are improved speed and better memory usage. This means that websites that use PHP 7 load faster than websites that use an older version of PHP and can handle more users at the same time.
Code wise, type declarations and new operators have been introduced. Error handling has also been improved.
Jobs
Since 75 percent of the web is powered by PHP there will obviously be a lot of jobs involving some sort of PHP coding. All these websites need to be maintained and there are PHP developers needed for that. The enormous market share of PHP won’t be gone overnight, so jobs involving PHP will be around in the future.
If you take a look at this link to the jobs section of Stack Overflow you will find a lot of jobs that require PHP.
Conclusion
Although there is a lot of discussion about the future of PHP, it is clear that PHP does have a future. It is by far the most used programming language for websites.
PHP has been around for a while now and this is reflected in the code. There’s a lot of old stuff that means the best solution is not always clear. Code wise you could use a framework that does a lot of the dirty work for you and forces you to write cleaner code. However, since the introduction of PHP 7, a lot of things have improved.
If you want to start a career as a PHP developer you won’t run out of options when it comes to finding a job. There are plenty of jobs involving PHP skills and this will stay the same in the near future.
So what do you think about PHP? Do you think there is a future for this programming language? Or is it dead?
Thanks for reading!
<3 koolreport team
October 8, 2019
We would like to inform that we have released new version KoolReport 4.3.0 ready for your upgrade. This is a worth upgrading version containing many improvements and important bug fixes.

Details
For further details of the changes in this new version, please follow these links:
This upgrade is backward compatible so feel free to upgrade now!
Some more good news
On further update, we have released a new chart package called D3. The package is built on top of D3JS (Data-Driven Documents) to provide visualization strength for KoolReport. D3JS is very famous Javascript library which is behind many beautiful charts and graphs. Except for the most common charts like Line or Pie, we have added Waterfall and FunnelChart to extend choices for your data visualization. IT IS JUST THE BEGINNING! More and more stunning charts will be added to D3 package.
KoolReport Pro 4.3.1 has been released as well with new core and the upgrades of 14 packages including Pivot, DataGrid, Export and more.. If you have KoolReport Pro license, you may upgrade now via manual download or composer installation. If you have not owned a license yet, please consider to get one now. You will love it!
P.S: KoolReport team wish you have a great day and do not forget to support us. We are and will work hard to bring you to best product saving you time & effort. That's our promise.
<koolreport team
December 14, 2018
KoolReport started as our internal project to standardize our report construction and growing to a strong framework for reporting. The strengths of KoolReport are its light-weight, speed, features extensibility and ability to integrate seamlessly into other PHP Frameworks.
We have put the first line of code in Jan 2017. Previously we have made thousand of reports for our customers. We saw the repeated tasks and common issues in making reports. That leads us to the thought of making a framework so that we could save time on repeated tasks and eliminate common issues.
Moreover, by having a standard framework for reports of all projects, we are able to manage code easier than before. Previously, each project followed different code patterns which make the took-over developer difficult to understand, fix code and develop further. But now, all reporting project follows the same pattern of code, the hand-over task become lesser and the documentation tasks are easier.
Take off
The KoolReport was first created solely for purpose of internal usage but we published it on GitHub and announced to KoolPHP users. Since then, we were very happy that KoolReport received very good feedbacks from thousand developers all over the world. Those are our great momentum to develop KoolReport further, adding more and more useful packages around it.
Until this time, we must say that KoolReport has become one of the top reporting framework or reporting tools. You may try to search google for “php report”, “php reporting tools” or “php reporting framework”, you may see us on top. That makes us very proud!
The concept of KoolReport is very simple, data is pulled from various data-sources, piped through series of processes then later saved to data store ready to be visualized. In the first phase, data connection, we provide PDODataSource as the main connectors to most common databases such as MySQL, SQL Server, Oracle etc. In the second phase. data processing, we provided over 30+ type of processes which you can use to transform your data. In the last phase, data visualization, Google Charts was chosen as our built-in charts library because of its power and the abundant of charts type.
KoolReport remains free and open-sources forever under MIT license which virtually does not bind you with any obligation when use KoolReport. You can download it, tweak it, use it, deliver it freely.
Around KoolReport core, we built a number of extended packages to extend its capability. A half of them are free for you use to just register and download. Some of them come with a tiny price, you consider the license purchasing as your donation to keep project going. We want KoolReport to go far so we need your help to fund the development and support.
KoolReport Pro
There is a special version of KoolReport called KoolReport Pro. This is an advanced version of KoolReport in which we combined KoolReport with all available extensions into single build. The compatibility between the core and extensions are guaranteed. We provide Developer License, Team License and Enterprise License for KoolReport Pro. Developer License is for individual who use KoolReport Pro to create reports for personal usage or for clients. Team License is for small team with max 5 developers. Enterprise License is for company which allows any developers within company can use KoolReport. Both of licenses comes with Priority Support and Free Upgrade privilege. Within a year, you will get support from our software engineer and data specialist to utilize the power of KoolReport Pro. And with the Free Upgrade privilege, you are free to download the latest library update with new features and new packages. Check out our KoolReport Pro if you are interested.
Get Started
To get started with KoolReport, please go ahead to our website koolreport.com and download the latest version of KoolReport. You may download, unzip and copy KoolReport folder into your web app or your can use Composer to install library. It is convenient in both ways.
We provide number of examples for you to start with. You may find the source code of all examples in the KoolReport & Examples version that you downloaded.
Remember to join our forum. There you can find all most all answers for your questions. If not, just simply create a new topic with your question, our support team will point you to the right direction. Or if you feel more convenient with Facebook, we have a group on Facebook that you can join and start discussing. Here is the group: KoolReport - The PHP Reporting Framework. Join us!
Resources
- Our website - Where all things begin.
- Forum - You may find all Q&A in here
- Examples & Demo - Over 100+ examples to demonstrate how KoolReport works
- Documentation - Documentation & API
- Blogs - This will keep you update of KoolReport releases, new packages, promotion & more.
- Github - You may clone or fork our project to play with it.
- Twitter - If you use Twitter, follow us to keep updated.
- Facebook Page - If you use Facebook, follow us to keep updated.
- Facebook Group - Keep update faster and interact with other members
Thank you very much and if you have any question, please let us know.
<3 koolreport team
August 9, 2018
Data storytelling will be a new exciting field in which science and art merge. And data become truly valuable only when they can drive our actions toward changes for better.

After your business has started collecting and gathering data from all sources, the next difficult step is to dig into those data and get the potential value of them. Your collected data is like a gold mine hidden deep down beneath the earth. The data analyst is like a gold miner digging into data to find valuable insights. But those insights can only become truly valuable if they can turn into actions or changes in your business. If those insights is not understood or does not look appealing to people, they are nothing more than pieces of metal. Google’s Chief Economist Dr. Hal R.Varian stated, "The ability to take data—to be able to understand it, to process it, to extract value from it, to visualize it, to communicate it—that’s going to be a hugely important skill in the next decades."
As data becomes increasingly ubiquitous, we have witnessed the hot trends of the jobs of data analysis and mining. LinkedIn recently reported that data analysis is consistently one of top 4 wanted skills in job description. But interestingly the last skill of transforming those data insights into actions is in less required although those top data analyst with advanced degrees in mathematics, economics, statistics struggle to communicate their insights to others effectively. Our ultimate goal is the change, we are getting close but still not reaching yet.
The demand of data storytelling skill will increase in the future. With the availability of self-service data tools, more and more people will be able to access the data insight by their own. As a result, more and more insights will be generated like never before. However, unless we enhanced the communication for those insights, we only see lower and lower conversion rate from insight-to-value. If people see those insight not appealing enough, change will never occurs. Data mean nothing!
Data Storytelling is a new term. Hearing the term, people normally think about the data visualization, info-graphics, dashboard, data presentation. Too often, people understand storytelling is just beautiful and clear charts and graphs. The truth is that data storytelling is a structured approach to communicate those insights, it involves combinations of three elements: data, visuals and narrative.
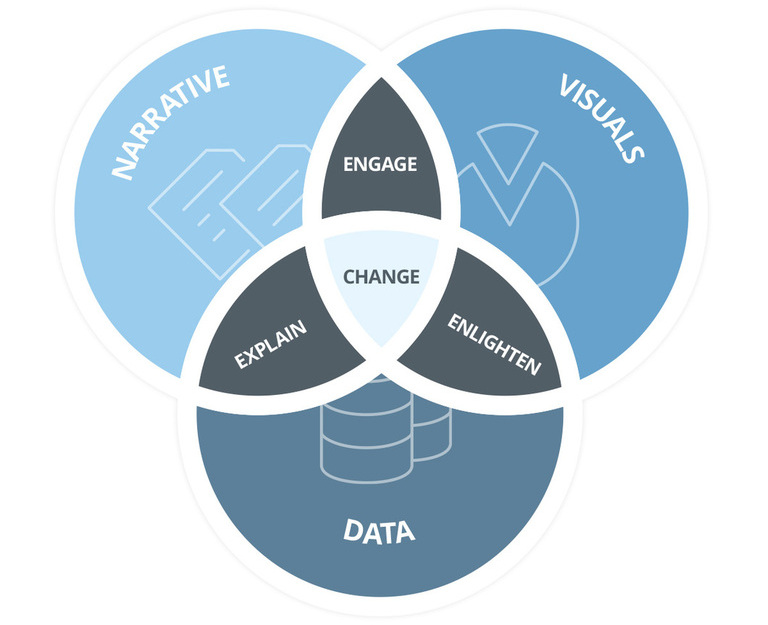
When we have data and narrative going along, we are explaining to our audience what is happening and maybe why. When data is coupled with visuals, we are enlightening the understanding of data. Seeing charts and graphs, we have have better feel of the trend. When visuals is applied to narratives, we are engaging our audience to the story. The effect is like we watch a good Hollywood movie. And with the combination of all three elements: data, visuals and narratives, we will explain, enlighten and engage our audiences. And by those actions, we may have the chance to drive our audiences to actions. That’s our ultimate goal.
The importance of data storytelling
Story has been going with us through the history. Our ancestors told us story of heros, our country emergence. Those story are passed from generation to generation and will be continued.
Today modern storytelling may be associated with TED for example and the analysis of the most 500 popular TED talks shows that storytelling made of 65% of their content. So we can see that storytelling is an effective way to convey ideas, thoughts and insights in the way that memorable, persuasive and engaging.
According to study, human decisions are often attached to emotion not logic. How many times we buy a thing because we want it and not because we need it? We buy a new phone to replace the last year model which is still working very well. So things that touch our emotion are the ones lead us to action. The data insights represented in numbers or charts and graphs touch us mostly in the logic layers but story touches us deeper in our emotion layers. That is the reason why story is much more effective in driving our actions by its power of memorability, persuasiveness and engagement.
Memorable: A study by Stanford professor Chip Heath (Made to Stick author) found 63% could remember stories, but only 5% could remember a single statistic. While 2.5 statistics were used on average in the exercise and only 10% of the participants incorporated a story, the stories are what caught people’s attention.
Persuasiveness: In another study, researchers tested two variations of a brochure for the Save the Children charity organization. The story-based version outperformed the info-graphic version by $2.38 to $1.14 in terms of per participant donations. Various statistics on the plight of African children were far less persuasive than the story of Rokia, a seven-year-old from Mali, Africa.
Engagement: Researchers also discovered people enter into a trance-like state, where they drop their intellectual guard and are less critical and skeptical. Rather than nitpicking over the details, the audience wants to see where the story leads them. As mathematician John Allen Paulos observed, “In listening to stories we tend to suspend disbelief in order to be entertained, whereas in evaluating statistics we generally have an opposite inclination to suspend belief in order not to be beguiled.”
Conclusion
Many great insights could be never be a gold if they are not fueled by a convincing story. Data storytelling will be a new exciting field in which science and art merge. And data become truly valuable only when they can drive our actions toward changes for better.
<3 koolreport team