The KoolReport Blog

Announcements, discussions, and more for KoolReport and its extended packages.

Top open source business intelligence and reporting tools

In this article, I review some of the top open source business intelligence (BI) and reporting tools. In economies where the role of big data and open data are ever-increasing, where do we turn in order to have our data analysed and presented in a precise and readable format? This list covers tools which help to solve this problem. Two years ago I wrote about the top three. In this article, I will expand that list with a few more tools that were suggested by our readers.
Note that this list is not exhaustive, and it is a mix of both business intelligence and reporting tools.

BIRT

BIRT originated from the open source Eclipse project, and was first released in 2004. BIRT is an open source technology platform used to create data visualizations and reports. Project sponsors include OpenText, IBM, and Innovent Solutions.

BIRT consists of several components. The main components include a report designer and the BIRT runtime, but BIRT also provides three extra components: a chart engine, chart designer, and viewer. With these components, you should be able to develop and publish reports as a standalone solution.

BIRT is written in Java, and is licensed under the Eclipse Public License. Its latest release, which runs on Windows, Linux, and Mac, can be downloaded here. Current development activities are shared through the project's most recent project plan.

JasperReport

JasperReport is one of the most popular and widely used open source reporting tools. It is used in hundreds of thousands production environments, and features both community and commercially-supported versions.

JasperReport consists of several components including the JasperReport Library, JasperReport Studio, and JasperReport Server. The library includes all of the core Java classes and APIs powering JasperReport. The ETL, OLAP, and server components provide JasperReport with important tools for enterprise environments, making it easier to integrate with the existing IT architecture of organizations. For a full overview and description of the components, visit the homepage of the JasperReport community.

JasperReport is supported by excellent documentation, a wiki, and additional resources. Written in Java, JasperReport runs on Windows, Linux, and Mac, and is available for download. Its latest release is from December 2015, and is licensed under AGPL.

Pentaho

Pentaho is a complete business intelligence suite, covering a gamut of use cases from reporting to data mining. The Pentaho BI suite encompasses several open source projects, of which Pentaho Reporting is one of them. Like the other tools, Pentaho Reporting has a rich feature set, ready for use in enterprise organizations.

The Pentaho BI suite also contains the Pentaho BI Server. This is a J2EE application which provides an infrastructure to run and view reports through a web-based user interface. Other components from the suite are out of scope for this article.

Pentaho is supported through many community resources such as documentation, wiki, and more. The tool runs on Java Enterprise Edition and can be used on Windows, Linux, and Mac. Its latest release is version 6.1 from April 2016, and is licensed under GPL. You can find downloads here.

SpagoBI

SpagoBI is another full business intelligence suite. Tools included in the suite are, for example: reporting, charts, cockpits, data-mining, ETL, and many more. The company behind it offers professional services such as user support, maintenance, consultancy, and training.

SpagoBI can integrate with many other tools, such as KeyRock identity manager, Orion Context Broker, and CKAN, the popular and widely used open data portal. It is certified for environments including Wildfly 8, 10 and JBoss EAP 7.

SpagoBI 5.2 was released in March 2016. Like some of the other tools, it is written in Java, and it is licensed under the Mozilla Public License version 2.0. Downloads are available here.

KNIME

KNIME is an open source analytics platform, with its origins in pharmaceutical research. Its use has expanded to industries such as banks, publishers, car manufacturers, telcos, and others.

KNIME provides a range of features, including collaboration extensions and a web portal. Machine learning is also integrated, including Weka support.

KNIME is written in Java, compatible with Linux, OS X, and Windows, and is licensed under the GPL. Its latest version was released December 2016, and can be downloaded here.

ReportServer

ReportServer is another open source business intelligence platform, with a commercial edition available as well. ReportServer allows for reporting, ad-hoc analyses, Excel and Word reporting, and multidimensional OLAP analytics.

ReportServer is based on Java and runs on Apache Tomcat, Wildfly, or other Java application server. Cloud and virtual images for Linux, OSX and Windows are provided by means of the Bitnami ReportServer Stack, and a native installer is availabel as well. The latest version, ReportServer 3.0, was released in March 2016, and is licensed under the AGPL. Installer packages, and virtual disk images are available as download.

Seal Report

Seal Report is an open source framework for producing reports and dashboard from any open database. Seal Report is fully open source, with Ariacom providing professional services such as consulting and training around the project.

Some of its features include support for dynamic SQL sources, native pivot tables, HTML5 charts, web report servers, and more. Seal Report is written in C#, and requires a recent version of Windows, including the .NET framework to run. Its latest version 2.1, was released May 2016, and is licensed under the Apache License version 2.0. Downloads are available on GitHub.

KoolReport

KoolReport is open source PHP Reporting Framework for faster and easier delivering report. KoolReport runs on PHP environment and can be considered a strong library to build report or dashboard for php web application. KoolReport is back by KoolPHP Inc, providing professional services like consulting and training as well.

The core KoolReport provides various data sources to connect to almost all common databases MySQL, SQL Server, Oracle, MongoDB. Beside databases, It can connect to CSV file as well as Excel file from Microsoft. It provides comprehensive data processing and great data visualization library. All are FREE.

If the use of core framework is not enough, you can download more extended packages to expand capability of KoolReport such as: pivot analysis, exporting report to PDF and other formats.

KoolReport is great choice for anyone looking for simple yet powerful solution.

Summary

All of these open source business intelligence and reporting tools provide a rich feature set ready for enterprise use. End users should do a thorough comparison and select the tool that best meets their needs. Some of the tools distinguishes themselves by specific features such as integration with machine learning, or availability of virtual machine and cloud images. Pick what works for you.

Source: https://opensource.com/business/16/6/top-business-intelligence-reporting-tools
KoolReport v.1.34.9

We have released new KoolReport version 1.34.9. This is small update with some enhancements and bug fixes.

Google Charts

Due to the change in loading Google Chart library, some of the charts such as GeoChart, Sankey, Organization failed to initiate. In this version, we have fixed this issue. If you used one of those charts please update. Other charts are still working well.

ArrayDataSource

In this version, we have added load() function to ArrayDataSource. Now you may use this load() to load array in setup() function of KoolReport. Previously the array data for ArrayDataSource must be input into the settings. The problem arises when settings() function is called multiple times and increases the memory usage unnecessarily. With this update, this happens no more.

function setup()
{
    $this->src('array_source')
    ->load(array(
        array("id"=>1,"name"=>"John"),
        array("id"=>2,"name"=>"Marry"),
    ))
    ->pipe(...)
    ...
}

Still you can insert the array data into $params of KoolReport and use the load() function to load: $this->src('array_source')->load($this->params["mydata"]).

Setting formatValue in Table

When using the koolreport\widgets\koolphp\Table, we can format the value just by set the column type and other settings. However, in some special case, we need more advanced format for value, we can use the formatValue settings. The formatValue can be string or function. For example:

<?php
Table::create(array(
    "columns"=>array(
        "column1"=>array(
            "formatValue"=>"$ @value", 
        ),
        "column2"=>array(
            "formatValue"=>function($value)
            {
                return '$ '.$value;
            }
        )
    )
));
?>

Setting {others} in Table

<?php
Table::create(array(
    "columns"=>array(
        "city",
        "{others}"=>array(
            "type"=>"number",
            "prefix"=>"$ ",
        )
    )
));
?>

Above code means that we add the city column in front and the rest of columns are formatted with currency settings.

Summary

Overall, through a series of updates, KoolReport has become stable and reliable in production stage. We are working hard to make KoolReport the best reporting framework you can find there.

<3 koolreport team

Understand data flow in KoolReport

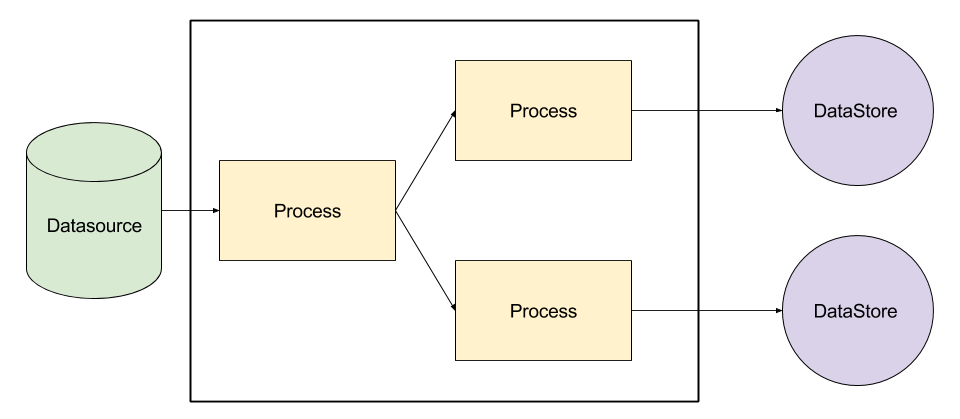
In this article, I would like to explain the data flow in KoolReport. Basically, data flow is like flow of water starting from data sources running through pipes to series of processing points until they reaches the data stores as final destination. The processing point will modify data as data pass through it.

Simple data flow

Above is the most basic flow of data, very straight-foward.

Example

$this->src('automaker')
->query("select * from orders")
->pipe(new Sort(array(
    "shipped_date"=>"desc",
)))
->pipe(new Limit(array(50)))
->pipe($this->dataStore("recent_shipped_orders"));

Branching data flow

The data from the source will be branched to different processes and stored in separate dataStores.

Example

$this->src('automaker')
->query("select * from orders")
->pipe(new Sort(array(
    "ordered_date"=>"desc",
)))
->saveTo($node);

$node->pipe(new Limit(array(50)))
->pipe($this->dataStore("recent_orders"));

$node->pipe(new Group(array(
    "by"=>"customerNumber",
    "sum"=>"amount"
)))
->pipe($this->dataStore("sale_by_customer"));

In above code, you see that we get all data from orders table of automaker datasource. Then we pipe to Sort process to sort data by ordered_date. Now the branching begins. We save the current position of pipe to $node variable for later used. The first branch is through Limit process to get only 50 first orders and save them to "recent_orders" data source. Now, the second branch starts from $node which is the Sort process, we pipe to Group to group data by customerNumber and sum the order amount. We pipe results to "sale_by_customer" data store.

Union data flow

Many times, our data is scattered in various sources and we want to bring them together to process. For example, you have orders of year 2016 in 2016_database and orders of years 2017 in 2017_database. How you can bring them together.

Example

$this->src('2016_database')
->query("select * from orders")
->saveTo($node);

$this->src('2017_database')
->query("select * from orders")
->pipe($node);

$node->pipe($this->dataStore("total_2016_and_2017_orders"));

As you can see in above code, orders in year 2016 is saved to $node. Then the orders of year 2017 are also piped to $node. After that, the $node will pipe data to "total_2016_and_2017_orders" data store.

Hope that the article helps you to understand the data flow in KoolReport.

<3 koolreport team

KoolReport v.1.27.6

Yeahhh! Party again in just 20 days! We just want to let you know that we have released new version 1.27.6. This version contains very important updates such as: ability to theme report, supporting old database connections, sorting columns by name or label.

{KoolReport's release Party

Theme your report

One of the most requested features that we received from our users is the ability to theme or style a report. A theme sets a report a consistent font, colors of chart, spacing and etc. As a result, we will have different look and feel for our report just by changing the one themes to another. In this new version, we can use a theme simple as below code:

<?php
class MyReport extends \koolreport\KoolReport
{
    use \koolreport\bluesea\BlueSeaTheme;
}

Although in this version, KoolReport is able to theme a report but we are still working on a theme to release. There is no theme demo right now but it will be soon. We will keep you update.

Support old database connection

Since the first version of KoolReport, we support the use of PDODataSource to connect to most common databases such as MySQL,SQL Server, Oracle and others. PDO has become standard of database connection. However, some of our users still request the old database connection. So we have added first two classes MySQLDataSource and SQLSRVDataSource to help to connect the most used databases.

Sort columns by name or labels

We have provided a new process called ColumnsSort which help to sort your list of columns in correct order. This process can be used after Cube or Pivot process to re-order the columns generated by them.

Some other minor updates

  1. Fix the initiation of Google Chart widgets, this fix is due to the change in google chart library.
  2. Move ExcelDataSource and MongoDataSource to separated packages. This will help to reduce the size of core packages. The packages for excel and mongodb will be distributed free under MIT License.
  3. Add debug() function to KoolReport so that we can see the all data available before creating view.
  4. Sort process now can sort data by custom comparison function.

The full updates list can be found here.

If you have any questions or comments on this new version, please go to this forum thread. All comments, good or bad, are welcome.

Thank you very much.

<3 koolreport team


KoolReport helps to analyze your data and ultimately turn them into visual reports or dynamic dashboards.

"KoolReport helps me very much in creating data report for my corporate! Keep up your good work!"

Alain Melsens

"The first use of your product. I was impressed by its easiness and powerfulness. This product is a great product and amazing."

Dr. Lew Choy Onn

"Fantastic framework for reporting!"

Greg Schneider
Get KoolReport Now, It's FREE!