Dear support team,
similar to the issue above I tried to create a geochart with markers like in the example from google above.
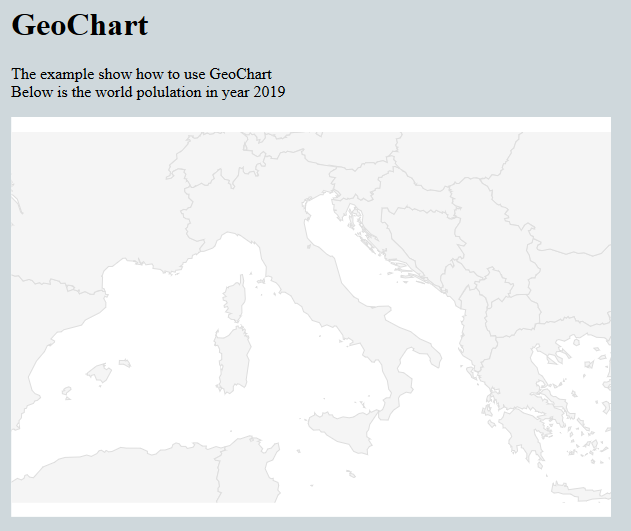
But unfortunately I get a blank page!
Could you please tell me what I'm doing wrong?
Here is my population2019.csv:
city;   population; area;
Rome;      2761477;    1285.31;
Milan;     1324110;    181.76;
Naples;    959574;     117.27;
Turin;     907563;     130.17;
Palermo;   655875;     158.9;
Genoa;     607906;     243.60;
Bologna;   380181;     140.7;
Florence;  371282;     102.41;
Fiumicino; 67370;      213.44;
Anzio;     52192;      43.43;
Ciampino;  38262;      11;
Here is my index.php
<?php

error_reporting(1);
require_once "autorepgeochart.php";
$autorepgeochart = new autorepgeochart;
$autorepgeochart->run();
?>

<!DOCTYPE >
<html>
  <head>
    <meta http-equiv="X-UA-Compatible" content="IE=edge" />
    <title>AutoRep: GeoChart</title>
	<link rel="shortcut icon" href="favicon.ico">
	<link rel="stylesheet" href="../autorep.css" />
  </head>
  <body>

	<div id="main">
		<?php $autorepgeochart->render();?>
	</div>
  </body>
</html>
Here is my autorepgeochart.php:
<?php

require_once "../koolreport/autoload.php";
use \koolreport\processes\Filter;
use \koolreport\processes\ColumnMeta;
use \koolreport\pivot\processes\Pivot;
use \koolreport\processes\Group;
use \koolreport\processes\Sort;
use \koolreport\processes\Limit;
use \koolreport\processes\Custom;
use \koolreport\cube\processes\Cube;
use \koolreport\cube\processes\RemoveColumn;
use \koolreport\cleandata\FillNull;

class autorepgeochart extends koolreport\KoolReport
{
    protected function settings()
    {
        return array(
            "dataSources"=>array(
                "population2019"=>array(
                    "class"=>'\koolreport\datasources\CSVDataSource',
                    'filePath'=>dirname(__FILE__)."population2019.csv",
                    "fieldSeparator"=>";"
                )
            )
        );
    }

    protected function setup()
    {
        $this->src("population2019")
        ->pipe($this->dataStore("population2019"));
    }
}
And here is my autorepgeochart.view.php:
<?php

	use \koolreport\pivot\widgets\PivotTable;
	use \koolreport\widgets\koolphp\Table;
	use \koolreport\inputs\MultiSelect;
	use \koolreport\inputs\Select2;
	use \koolreport\inputs\CheckBoxList;
	use \koolreport\inputs\RadioList;
	use \koolreport\inputs\DateTimePicker;
	use \koolreport\widgets\google\BarChart;
	use \koolreport\widgets\google\PieChart;
	use \koolreport\widgets\google\ComboChart;
	use \koolreport\widgets\google\ColumnChart;
	use \koolreport\widgets\google\LineChart;
	use \koolreport\widgets\google\Chart;
	use \koolreport\widgets\google\GeoChart;
	use \koolreport\widgets\google;

?>

	<div id="col1">
		<div class="report-container">
			<div class="text-center">
				<h1>GeoChart</h1>
				<p class="lead">
					The example show how to use GeoChart <br/> Below is the world polulation in year 2019
				</p>
			</div>

			<div style="margin-bottom:50px;">
			<?php
				GeoChart::create(array(
					"dataSource"=>$this->dataStore("population2019"),
					"columns"=>array("city","population","area"),
					"options"=>array(
						"region"=>"IT",
						"displayMode"=>"markers",
						"colorAxis"=>array(
							"colors"=>array("green","blue")
						)
					)
				));
			?>
			</div>
		</div>
	</div>

  </body>
</html>
Thx a lot in advance for your hint!
Kind regards,
bysystem