KoolReport's Forum

Official Support Area, Q&As, Discussions, Suggestions and Bug reports.
Forum's Guidelines

Datalabels for ApexCharts - can't align to the left #3363

Open Nathan Skelton opened this topic on on Oct 24 - 5 comments

Nathan Skelton commented on Oct 24

Hello, I would like to align the datalabels (the labels on the bars in a bar chart) to the left but the code in this example isn't working: https://www.koolreport.com/examples/reports/apexcharts/bar/custom_data_labels/

And here is my code:

                                                    "dataLabels" => [
                                                        "style | colors" => [
                                                            "#fff"
                                                        ],
                                                        "textAnchor" => "start",
                                                        "offsetX" => 0,
                                                        "formatter" => "function (value) {
                                                                            return value.toLocaleString();
                                                                        }",
                                                        
                                                    ],

And my chart looks like this:
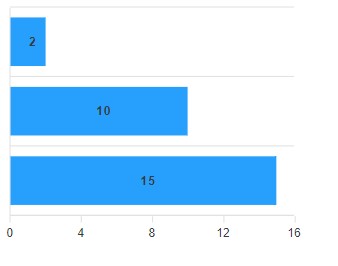
Bright commented on Oct 25

You need to add the following code to options:

'plotOptions | bar' => [
    'dataLabels | position' => 'bottom',
    ],
Nathan Skelton commented on Oct 30

I have that and now they are left aligned but they are bumping into the y-axis:

"height" => "300px",
                                            "width" => "100%",
                                            "showLabel" => true,
                                            "options" => array(
                                                "legend" => array(
                                                    "show" => false,
                                                ),
                                                "xaxis" => [
                                                    "labels" => [
                                                        "formatter" => "function (value) {
                                                                            return value.toLocaleString();
                                                                        }"
                                                    ]
                                                ],
                                                "dataLabels" => [
                                                    "formatter" => "function (value) {
                                                                        return value.toLocaleString();
                                                                    }"
                                                ],
                                                "tooltip" => [
                                                    "y" => [
                                                        "formatter" => "function (value) {
                                                                        return value.toLocaleString();
                                                                    }"
                                                    ]
                                                    ],
                                                'plotOptions | bar' => [
                                                    'barHeight' => '60%',
                                                    'distributed' => true,                               
                                                    'dataLabels | position' => 'bottom',
                                                ],
                                            )

Bright commented on Oct 31

Hi, You do this:

'dataLabels' => [
                    'textAnchor' => 'start',
                    'offsetX' => 10, 
                    'formatter' => 'function (value) {
                        return value.toLocaleString();
                    }',
                ],
Nathan Skelton commented on Nov 4

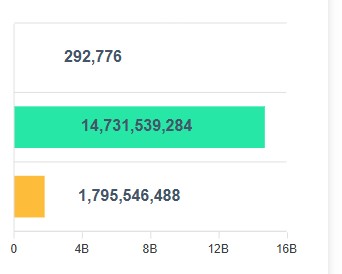
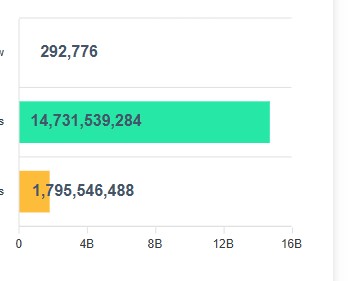
Thank you! With the textAnchor setting it looked weird:

Without textAnchor it looks better but the top number is not left-aligned with the bottom two. Do you think that might be because the numbers are so far apart (i.e., the top one is 6 digits and the bottom two are at least 10 digits)?

Bright commented on Nov 5

Yes, I see the same situation when data discrepancy is large

Build Your Excellent Data Report

Let KoolReport help you to make great reports. It's free & open-source released under MIT license.

Download KoolReport View demo
help needed

ApexCharts