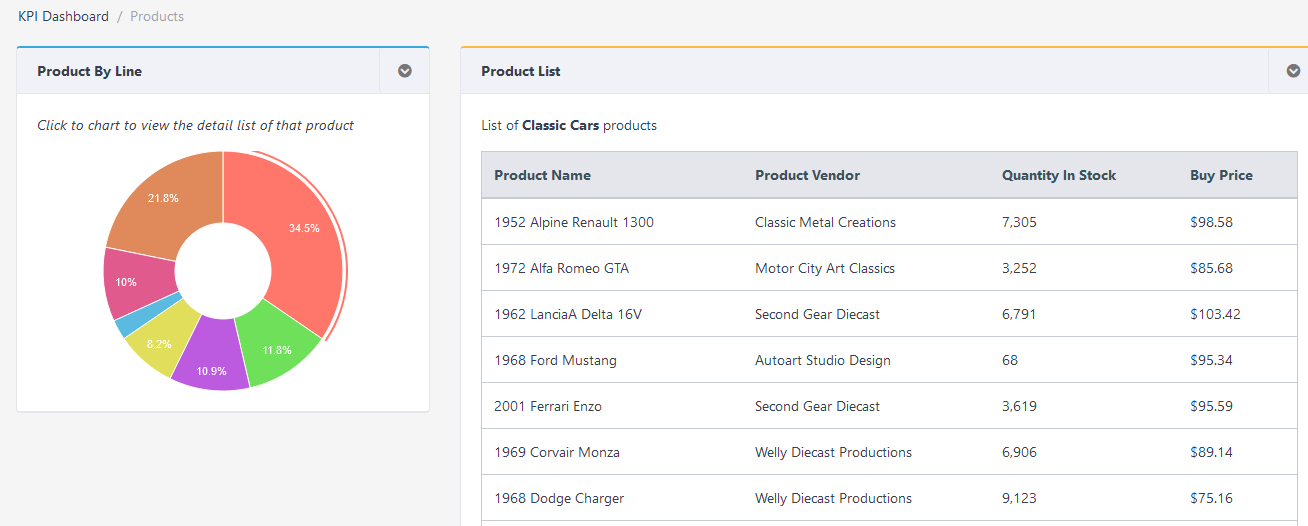
How can i implement something like the actionRowSelect($request, $response) in Apexcharts? I mean something like the example in KPI Dashboards / Products where i click on a Donut slice and i get the records on the table beside. I think there is dataPointSelection method but i i couldn't find any documentation... Can you help with a small example?
KoolReport's Forum
Official Support Area, Q&As, Discussions, Suggestions and Bug reports.
Forum's Guidelines
ApexCharts item select #3201
So far KoolReport's ApexCharts package has not had own client events yet but you can use the default events of the apexcharts javascript library like this:
In normal report:
        \koolreport\apexcharts\ColumnChart::create(array(
            ...
            "options" => [
                'chart | events | dataPointSelection' => "function(event, chartContext, config) {
                    // The last parameter config contains additional information like `seriesIndex` and `dataPointIndex` for cartesian charts
                    console.log('chart dataPointSelection');
                }",
Or in Dashboard:
class ColumnChartDemo extends ColumnChart
{
    protected function onCreated()
    {
        $this->settings([
            "stacked" => true,
            "stackType" => "100%",
            "options" => [
                "chart | events | dataPointSelection" => "function(event, chartContext, config) {
                    // The last parameter config contains additional information like `seriesIndex` and `dataPointIndex` for cartesian charts
                    console.log(chartContext, config);
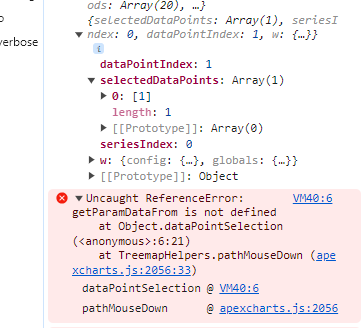
                    params = getParamDataFrom(chartContext, config);
                    widgetAction('ColumnChartDemo','itemSelect',params);
                }",
            ],
        ]);
    }

    protected function actionItemSelect($request, $response)
    {
        //...
    }
We have tested HeatMapChart and the event dataPointSelection is working for it, too, in both normal report and Dashboard:
//Dashboard widget
class HeatMapChartDemo extends HeatMapChart
{
    protected function onInit()
    {
        $this
        ->settings([
            ...
            'options' => [
                'chart | events | dataPointSelection' => "function(event, chartContext, config) {
                    console.log('HeatMapChart dataPointSelection');
                }",
            ]
        ]);
    }
//KoolReport Pro widget
        \koolreport\apexcharts\HeatMapChart::create(array(
            ...
            "options" => [
                'chart | events | dataPointSelection' => "function(event, chartContext, config) {
                    console.log('HeatMapChart dataPointSelection');
                }",
            ],
If you still can not see the console log message pls post your code for us to check it for you. Rgds,
Pls add the widgetAction command to the event listener as well:
                "chart | events | dataPointSelection" => "function(event, chartContext, config) {
                    // The last parameter config contains additional information like `seriesIndex` and `dataPointIndex` for cartesian charts
                    console.log(chartContext, config);
                    params = getParamDataFrom(chartContext, config);
                    widgetAction('ColumnChartDemo','itemSelect',params); //send ajax request to server so that Dashboard ApexCharts widget's php funtion actionItemSelect() is performed on server side
                }",
Yes of course and i had added the widgetAction, but it doesn't work. Later i have this to my class:
protected function actionItemSelect($request, $response)
{
    $params = $request->params();
I also added this part to test further (as your example shows):
public function selectedProductLine()
{
    return $this->state("selectedProductLine");
}
Do you see this console.log output in your browser's dev console?
                "chart | events | dataPointSelection" => "function(event, chartContext, config) {
                    // The last parameter config contains additional information like `seriesIndex` and `dataPointIndex` for cartesian charts
                    console.log(chartContext, config); // check this console.log output
                    ...
Sorry for the delayed reply. It looks like the event listener function runs correctly. What you must do is build the parameter needed:
    params = getParamDataFrom(chartContext, config); // write this function yourself to get a needed parameter from chartContext and config
    widgetAction('ColumnChartDemo','itemSelect',params);  // send the itemSelect request attached with the needed parameter
Build Your Excellent Data Report
Let KoolReport help you to make great reports. It's free & open-source released under MIT license.
Download KoolReport View demo
