KoolReport's Forum

Official Support Area, Q&As, Discussions, Suggestions and Bug reports.
Forum's Guidelines

Table format not working and tooltip for KPI indicators #870

Open Rajesh opened this topic on on May 15, 2019 - 10 comments

Rajesh commented on May 15, 2019

Hello Koolreport,

Based on your help on the topic "https://www.koolreport.com/forum/topics/826", we created the below image table with KPIs using second solution. But, the table does not look formatted. Below KPI table image is how it is showing up.

KPI table image:

We used "use \koolreport\widgets\koolphp\Table;" package in the code and the table layout as

"cssClass"=>array(

        "table"=>"table table-hover table-bordered"
    )"

Also, we are trying to show custom tool tip for above KPI indicators. When you hover on the arrow, it should show the values as below:

Rev Prev Day :$25512

Rev Prev 2nd Day: $25000

Difference: $512 (Value should be green when positive and value should be red when negative)

Could you please help us with above two issues?

Thanks,

Rajesh.

Rajesh commented on May 17, 2019

Hello KoolReport,

Can you please let me know?

Thanks, Rajesh.

David Winterburn commented on May 24, 2019

Hi Rajesh,

Did you include Bootstrap in your page? Thanks!

Systemhaus Rudolph GmbH Sangerhausen commented on May 24, 2019

Hello, 
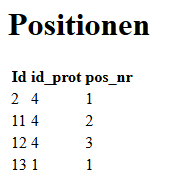
I've got the same problem, that my table ist unformatted. It looks like

Second problem: The export function also doesn't work when I activate the last line in my protokoll_index.php (that means no PDF file is created).

Thanks for your help! Rosita Johlke

I've done the following:

protokoll.php

<?php require_once "koolreport/autoload.php";

use \koolreport\KoolReport; use \koolreport\bootstrap3; //use \koolreport\clients\Bootstrap;

class r_ah_protokoll extends KoolReport { use \koolreport\export\Exportable;

protected function settings()
{
    return array(
    "assets"=>array(
        "path"=>"koolreport/bootstrap3/assets",
        "url"=>"/assets"
    ),
	"dataSources"=>array(
		"dbt"=>array(
			"connectionString"=>"mysql:host=localhost;dbname=buch",
			"username"=>"root",
			"password"=>"",
			"charset"=>"utf8"
            ),
        )
    ); 
}    
protected function setup()
{
    $this->src('dbt')
    ->query("SELECT id, id_prot, pos_nr FROM ah_protokolle_pos")
    ->pipe($this->dataStore('ah_prot_pos'));
} 

} ?>

protokoll.view.php

<?php use \koolreport\widgets\koolphp\Table; ?>

Positionen

$this->dataStore('ah_prot_pos'), "columns"=>array( "id"=>array("label"=>"Id", "type"=>"number"), "id_prot"=>array("label"=>"id_prot","type"=>"number"), "pos_nr"=>array("label"=>"pos_nr","type"=>"number") ), "cssClass"=>array("table"=>"table table-hover table-bordered") )); ?>

protokoll_index.php

<?php require_once "r_ah_protokoll.php"; $report = new r_ah_protokoll; $report->run()->render(); //$report->run()->export('r_ah_protokoll_pdf')->pdf(array("format"=>"A4","orientation"=>"portrait"))->toBrowser("ah_protokoll.pdf"); ?>

protokoll_pdf.view.php

<?php

use \koolreport\widgets\koolphp\Table;

?> <html>

<body style="margin:0.5in 1in 0.5in 1in">
    <link rel="stylesheet" href="koolreport/bootstrap3/assets/core/css/bootstrap.min.css" />
    <link rel="stylesheet" href="koolreport/bootstrap3/assets/core/css/bootstrap-theme.min.css" />   
    <div class="page-header" style="text-align:right"><i>Positionen</i></div>
    <div class="page-footer" style="text-align:right">{pageNum}</div>
    <div class="text-center">
        <h1>Positionen</h1>
    </div>
    <hr/>

    <?php
	Table::create(array(
		"dataStore"=>$this->dataStore('ah_prot_pos'),
		"columns"=>array(
			"id"=>array("label"=>"Id", "type"=>"number"),
			"id_prot"=>array("label"=>"id_prot","type"=>"number"),
			"pos_nr"=>array("label"=>"pos_nr","type"=>"number")
			),
		"cssClass"=>array("table"=>"table table-hover table-bordered")
	));
    ?>
</body>

</html>

Rajesh commented on May 28, 2019

Hi David,

Thanks for the response. We did include bootstrap package use \koolreport\clients\Bootstrap; which did not help us resolve the issue. But, after using developer tools on one of Koolreport's working example for Table, we were able to identify missing bootstrap links which were not being loaded with our Table. After including below code, we were able to resolve the table formatting issue.

<head>
	<link rel="stylesheet" type="text/css" href="/koolreport/src/clients/bootstrap/css/bootstrap.min.css">
	<link rel="stylesheet" type="text/css" href="/koolreport/src/clients/bootstrap/css/bootstrap-theme.min.css">	
</head>

Can you please respond to the second part of my initial question regarding "tooltip for KPI indicators"?

David Winterburn commented on Jun 4, 2019

Hi Rajesh,

Sorry for the delayed reply! Regarding your question about tooltips for KPI indicators, I think it could depend on your indicator icon type but generally please try to add a "title" attribute to the icon to see if it works. For example:

<i class="fa fa-cog" title="Do you like my fa-coq icon?"></i>

Let us know if we understand your question correctly. Thanks!

Rajesh commented on Jul 22, 2019

Hi David,

Thanks for the response and sorry for the delayed reply. I somehow missed your response for the tool tip. The solution which you provided works for static text but I want to generate dynamic tool tip when mouse hover on the arrow. Below image tooltip (highlighted in green) should be generated when I mouse hover on "Revenue 7day Avg" column green arrow for "BusLine2" row. This tooltip would explain why the arrow is in green color. It is green in color because it is comparing "Revenue 7day Avg" with "Revenue Prev Day" and since "Revenue Prev Day" is greater the arrow is in green color. Also, the tooltip should show difference of both values which is shown in below image. I would be changing the field names and populating the code for all columns to show different tooltip on mouse hover.

Below is the code used to populate the cell value and arrow color.

'avg7DayRevenue' => array(
                    "cssStyle"=>"text-align:center;font-weight:600;",  
					"label"=>"Revenue 7day Avg",
					"formatValue"=>function($value,$row)
						{
							$color = $value< $row["prevDayRevenue"]?"#408254":"#e83e8c";
							return "<span style='color:$color'>$".number_format($value)."</span>";
						}						
                ),	

Please let me know if this explains the question or if you need more details.

Thanks, Rajesh.

David Winterburn commented on Jul 23, 2019

Hi Rajesh,

When you use the map process or the "formatValue" function, just get the Revenue Prev Day and Revenue 2day Avg values, calculate their difference to construct the tooltip string. Then put the tooltip string to the "title" of either the div, span or icon. If your tooltip needs line break, please try this link:

https://www.bootply.com/83099#

or:

https://stackoverflow.com/a/9118551/2873057

Let us know if you need anything more specifically. Thanks!

Rajesh commented on Jul 23, 2019

Hi David,

Thanks for the response. I was able to implement the dynamic value in tooltip based on your response. Could you please let me know if I can color code code the "Difference" value? I want to show it as green when it is positive and red when it is negative. Below is the code which I implemented. Line break did not work in our case so I used new line.

'avg7DayRevenue' => [
				"cssStyle"=>array(
                    "th"=>"font-weight:bold;text-align:center",
                    "tr"=>"text-align:center",                    
                ),
                'formatValue' => function($value, $row) {
						$title = 'Prev Day Revenue:   $'.number_format($row["prevDayRevenue"]);
						$title .= "\n7day Avg Revenue:   $".number_format($row["avg7DayRevenue"]);
						$title .= "\nDifference:   $".number_format($row["prevDayRevenue"] - $row["avg7DayRevenue"]);
                        $kpi = $value <= $row["prevDayRevenue"] ?
                            '<img src = "green.png" width = "8" height = "15">': '<img src = "red.png" width = "8" height = "15">'; 
                        $value = "<span title='$title'>".$kpi . '&nbsp;&nbsp;&nbsp;&nbsp;&nbsp;$' . number_format($value)."</span>";
                        return $value;
                },
				"label" => "Revenue 7day Avg"
            ],

Thanks,

Rajesh.

David Winterburn commented on Jul 25, 2019

Hi Rajesh,

With standard tooltip using "title" attribute, I'm afraid there hasn't had any method to customize its style (font-color, etc). For that purpose, probably you would have to find help from third party library. For example:

https://jqueryui.com/tooltip/#default

Thanks!

Rajesh commented on Jul 25, 2019

Hi David,

Thanks for the response. I shall look into third party libraries.

Thanks,

Rajesh.

Build Your Excellent Data Report

Let KoolReport help you to make great reports. It's free & open-source released under MIT license.

Download KoolReport View demo
help needed

None