KoolReport's Forum

Official Support Area, Q&As, Discussions, Suggestions and Bug reports.
Forum's Guidelines

Replicate report #844

Open gkurl opened this topic on on May 1, 2019 - 28 comments

gkurl commented on May 1, 2019

Hi Guys,

I am trying to replicate this sort of report within KoolReport:

Between Table and PivotTable I am unable to do so.

I have my query setup - the same query that generated the data in the screenshot above but it uses a different reporting engine but I need this in KoolReport.

Any guidance would be appreciated on how to best achieve this format and display of Data within KoolReport.

Happy to share code etc.

I am restricted to only being able to try and achieve this from within the template as I can not "pipe" results like in PivotTable documentation - I can only pipe the resultsets the query returns and then proceed to customise them in the template.

Please let me know.

Thanks.

David Winterburn commented on May 2, 2019

Hi,

Please use PivotTable with our Instant package which allows SinglePage report. Let us know if it meets your requirement. Thanks!

gkurl commented on May 2, 2019

Hi David,

Thanks for your reply. I am already trying to use PivotTable and SinglePage report - but I can not customise the column groupings to how the picture looks like, maybe this is SinglePage restriction due to how "Pipe" is required in setup() method?

I need it so that I can show cost vs budget per site like in first screenshot which in my data is "SITE_B" for example. But this could be many other sites. How can I group together "Week 1 cost" with "Week 1 budget", "week 2 cost" with week 2 budget" etc.

Currently report looks like this as simple example for one site:

I would appreciate any suggestions as to how best to get as close as possible to my first screenshot

Also how to do prefix's like £ or $ sign like in Table?

Thanks.

David Winterburn commented on May 2, 2019

Hi,

Would you please post your report's php code for us to check it for you? Thanks!

gkurl commented on May 2, 2019

Hi thanks for quick reply.

Yes sure - it may need some explaining in parts :)

Template:

                     <?php
				 //Basic headers - choose what charts you want to include.
				 
                 use \koolreport\widgets\koolphp\Table;
				 use \koolreport\widgets\google\PieChart;
				 use \koolreport\widgets\google\BarChart;
                 use \koolreport\widgets\google\ColumnChart;  
                 use \koolreport\clients\Bootstrap; use \koolreport\pivot\widgets\PivotTable;
use \koolreport\datagrid\DataTables;


                 ?>
				 
				 <!-- Change page title, page styling here -->
                 <html>
                 <head>
                     <meta charset="utf-8" />
                     <meta http-equiv="X-UA-Compatible" content="IE=edge">
                     <title>Employee Performance</title>
                     <meta name="viewport" content="width=device-width, initial-scale=1">
                 </head>
                 <body>
				          <header style='height:30px'>
            <div class="page-header"> <?php Table::create(['dataSource' => resultset1, 'columns' => [
				'Header1' => ['label' => '']]]);                                
 ?> </div>
        </header>
				 
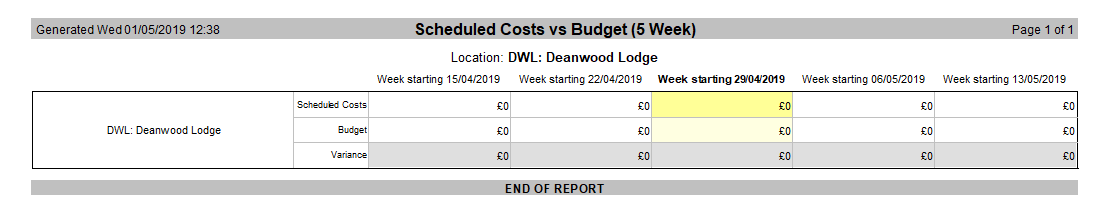
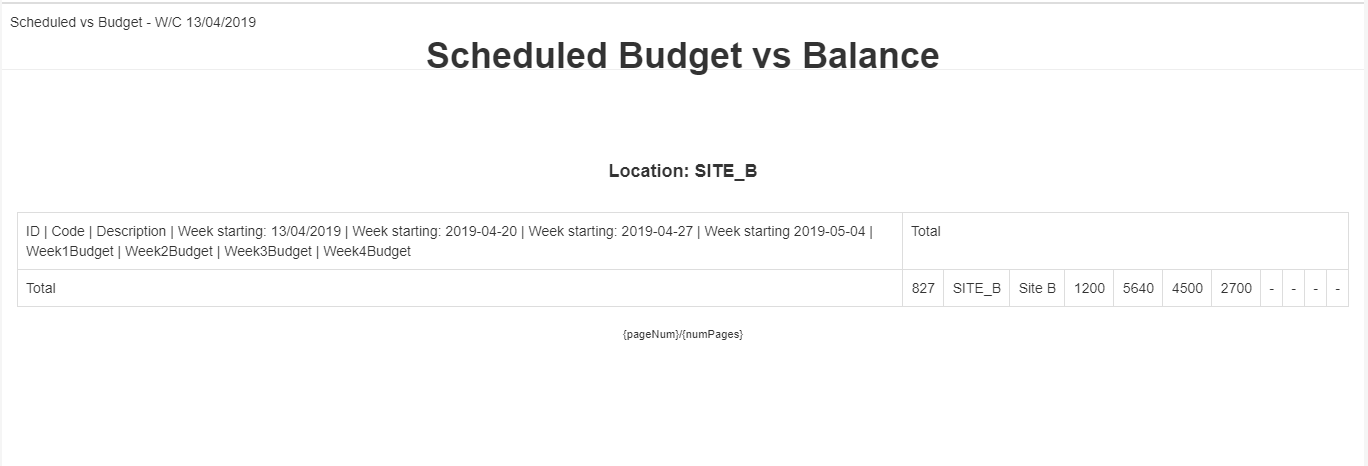
                 <h1 class ="title"> Scheduled Budget vs Balance </h1></br></br>
				  <h4> <?php Table::create(['dataSource' => resultset1, 'columns' => [
				'Header2' => ['label' => '']], 'cssClass' => ["table" => "tablesubheading subheading"]]); ?>  </h4>
				 <img src = "http://dev.maxdev.co.uk/koolreport/menulogob@3x.png" class = "logo img-fluid" width = "200px" height = "200px">
                   <div class = "container-fluid">
                                  <style> 

									.subheading {
										text-align:center;
										font-weight:bold;
										border: none !important;
										
									}
									
									.tablesubheading td {border: none !important}
									.tablesubheading tr {border: none !important}
									.tablesubheading th {border: none !important}


                    @media screen and (max-width: 360px) {
                             h1{
                          font-size:14px;
                      }
                    }
                 
                 body {       
                 
                    font-family: 'Raleway', sans-serif;
                 }  
                 
                 @media print
                {       
            .table-striped > tbody > tr:nth-of-type(odd) > td {
                background-color: #f9f9f9 !important;
				
			.table td {border: none !important;}
			.table th {border: none !important;}
			.table tr {border: none !important;}


                 }  
                 
                      .tablecustom td:nth-child(1) {
                    
                     background-color:#3A6BB4;
					 font-weight: bold;
					 color: white;
                    
                }
            
        }
                 
                .title {
                text-align: center;
                font-weight: bold;
                }
                
                .table row-group:first-child .table tr:last-child {
                position: absolute;
                right: 0;
                }
                
                .totalcell {
                background: #275DAD;
                color: white;
                }
                
                .logo { 
                 
                 position: absolute;
                 left:0;
                 top:0; 
                max-width: 70%; 
                height: auto; 
                padding: 20px 20px;
                 }                     
                 
                 @media screen and (max-width: 768px) {
                             h1{
                          font-size:14px;
                      }
                    }
                
                </style>
				
				<!-- This is where data charts should go below the php tag --> 
                   
<?php

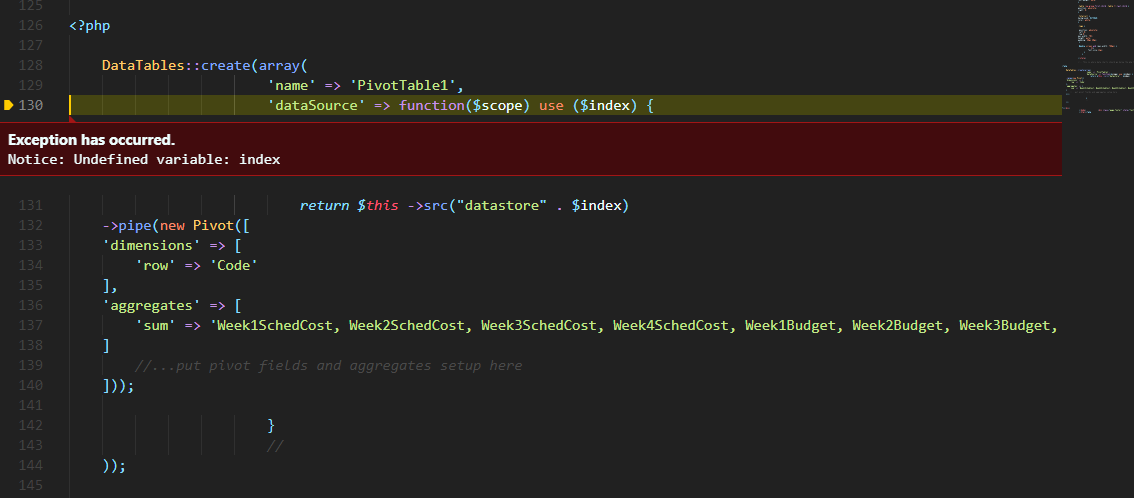
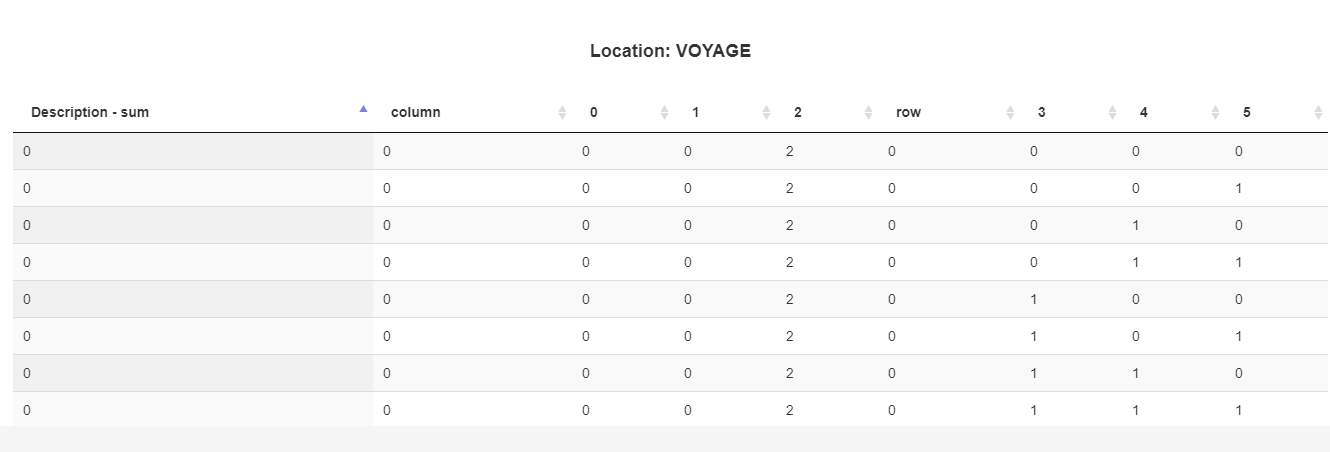
	PivotTable::create([
	'dataSource' => resultset2,
	 'grouping' => ['Code']
  ]);
	
    
?></div>
                 </body>            <div class="page-footer" style="text-align:center; font-size:0.8em;">{pageNum}/{numPages}</div>
                 </html>

My report class that handles ALL reports and pipes resultsets from queries (doing per page report not possible so had to make one class that handles all report setup):

<?php

class MaxtimeKoolReport extends \koolreport\KoolReport {

    use \koolreport\export\Exportable;
    use \koolreport\clients\Bootstrap; 
    use \koolreport\clients\jQuery;


    protected $template;
    protected $resultset;

    public function __construct($template, $resultset)
    {
        $this -> template = $template;
        $this -> resultset = $resultset;
        parent::__construct();
        
    }

    //internal template from DB

    public function settings() {

        $index = 1;

        foreach($this -> resultset as $r) {

            //DO STUFF
            $resultset['datastore' . $index] = [
                "class"=>'\koolreport\datasources\ArrayDataSource',
                "dataFormat"=>"associate",
                "data" => $r];

            $index++;

        }

        return ['dataSources' => $resultset, "assets" => ["path" => "/koolreport", "url" => "http://dev.maxdev.co.uk/koolreport"]];

    }


    public function setup() {

        $index = 1;

        for($i=0; $i < count($this -> resultset); $i++){

            $this -> src("datastore" . $index)
            ->pipe($this -> dataStore('resultset' . $index));

            $index++;
        }
    }

    public function isfile($param) { 
        return true;
    }

    public function doCustomRender() {

        foreach($this -> dataStores as $k => $v) {

            if(strpos($this -> template, $k) !== false){

                $search_string = $k . ",";
                
             
                $this -> template = str_replace($search_string, '$this -> dataStore(' . "'" . $k . "'" . '),', $this -> template);
               // $this -> template = preg_replace("/($k)/i", '$this -> dataStore(' . "'" . $k . "'" . ')', $this -> template);
            }
        }

        // if (!is_dir('test/')) {
        //     // dir doesn't exist, make it
        //     mkdir('test/', 0777, true);
        //   }
          
        // file_put_contents('test/template.php', $this -> template);

       eval("?>" . $this -> template . "<?php ");

       return true;


    }

    public function isCustomRender()
    {
        return true;
    }
}
gkurl commented on May 2, 2019

So I'm thinking- I need to do a SinglePage PivotTable report but specify the dimensions and aggregates in the template somehow instead of in the setup() method - this is the key problem I believe.

Waiting on your reply :)

Thanks.

David Winterburn commented on May 7, 2019

Hi,

Sorry for the late reply. I'm not sure if I fully understand your code yet but why don't you pipe the Pivot process to this code before piping to the datastores result set:

$this -> src("datastore" . $index)
->pipe($this -> dataStore('resultset' . $index));

Please try:

$this -> src("datastore" . $index)
->pipe(new Pivot([
    //...put pivot fields and aggregates setup here
]))
->pipe($this -> dataStore('resultset' . $index));

Let us know what you think . Thanks!

gkurl commented on May 8, 2019

Hi David,

Thanks for your reply. I had actually thought of this, but adding that in would make it pipe for ALL reports as ALL reports are handled by that one class I posted earlier. Which means the pipe would only be applicable for one Pivot table and I will have multiple.

Process is a little like this

Reports are stored in a table where the whole PHP template and name of stored procedure to run is kept

So table is structured like:

ReportName1    Template1(Full PHP code)    ProcedureName1
ReportName2    Template2(Full PHP code)    ProcedureName2

Etc.

Report table is queried > procedure is run > Resultset and template are passed in and piped by MaxtimeKoolReport class.

So you can see why the class needs to be abstract/generic enough to pipe any given resultset. If I start pipe for Pivot then it will only be specific for one Pivot table.

I know you guys are better than me at this so please any ideas on how to work around :) Hopefully what I said makes sense let me know if it needs some more explanation. If in same way you can customise table in the Template using SinglePage format and do the Pivot Pipe in the template that would be most ideal?

David Winterburn commented on May 9, 2019

Hi,

Please try this approach: in your report's view file or single page create the PivotTable widget directly with its dataSource property as a function:

DataTables::create(array(
                    'name' => 'PivotTable1',
                    'dataSource' => function($scope) use ($index) {
                        return $this ->src("datastore" . $index)
->pipe(new Pivot([
    //...put pivot fields and aggregates setup here
]))
                        ;
                    },
                    ...
))

Let us know if this works out for your case. Thanks!

gkurl commented on May 9, 2019

Hi David,

Thank you for your suggestions, this appears like it may work. I have tried implementing it and am getting the following error in my debug.

Let me know. Thanks.

David Winterburn commented on May 9, 2019

Hi,

Please set the variable $index according to your choice as datasource for this PivotTable. I get it from this part of your code:

        $index = 1;

        for($i=0; $i < count($this -> resultset); $i++){

            $this -> src("datastore" . $index)
            ->pipe($this -> dataStore('resultset' . $index));

            $index++;
        }

Thanks!

gkurl commented on May 9, 2019

Hi David,

I have managed to get it partially working - thank you for your suggestions so far they have been super helpful! Just a few more questions:

  1. Is there a way to specify multiple 'sum' aggregates?

  2. Can you specify "label" type property for column and/or row?

  3. Can you specify "columns" property type? In combination with 'row'?

  4. Is 'aggregates' mandatory property? If I leave it out, I get a "no data available in this table" message?

  5. How to set row grouping to prevent duplicate values?

Thanks.

gkurl commented on May 9, 2019

Also. none of my columns/rows seem to be mapping properly? The aggregate is causing problems because without it my data does not render. Currently I am seeing this:

gkurl commented on May 13, 2019

Any updates?

David Winterburn commented on May 14, 2019

Hi,

Would you please post your updated php code for the DataTables and pivot? Thanks!

gkurl commented on May 14, 2019

Hi David,

Sure here is the snippet:

<?php
	$index = 2;
	DataTables::create(array(
		 'name' => 'PivotTable',
		 'dataSource' => function($scope) use ($index) {
		 return $this ->src("datastore" . $index)
	->pipe(new Pivot([
		'dimensions' => [
			'column' => 'Week1Budget', 'Week2Budget', 'Week3Budget', 'Week4Budget',
			'row' => 'Week1SchedCost', 'Week2SchedCost', 'Week3SchedCost', 'Week4SchedCost'
		]
		
	]));
	
						}
						//
	));

As you may be able to tell, I am trying to compare budgets and scheduled costs over a 4 span week, matching each weeks budget and scheduled cost with each other.

Let me know. Thanks.

David Winterburn commented on May 15, 2019

Hi,

It must have been my fault in the previous posts. Would you please change your code to:

<?php
	$index = 2;
	PivotTable::create(array( //use PivotTable widget for Pivot datastore instead of DataTables
		 'name' => 'PivotTable',
		 'dataSource' => function($scope) use ($index) {
		 return $this ->src("datastore" . $index)
	->pipe(new Pivot([
		'dimensions' => [
			'column' => 'Week1Budget', 'Week2Budget', 'Week3Budget', 'Week4Budget',
			'row' => 'Week1SchedCost', 'Week2SchedCost', 'Week3SchedCost', 'Week4SchedCost'
		]
		
	]));
	
						}
						//
	));

Let us know the result. Thanks!

gkurl commented on May 15, 2019

Hi,

Thanks - I am receiving this error now however:

"ArgumentCountError: Too few arguments to function api\v7000\MaxtimeKoolReport::{closure}(), 0 passed and exactly 1 expected"

Let me know.

Thanks.

David Winterburn commented on May 16, 2019

Hi,

Please try removing the argument $scope from the dataSource function and see how it goes. Thanks!

gkurl commented on May 16, 2019

Hey David,

Thank you for your on-going support so far, I have managed to get it generating but it is showing like this:

It says {{other}} for all fields :( Please let me know how I can fix?

Thanks.

David Winterburn commented on May 16, 2019

Hi,

"{other}" value often represents null value of a field in a data row. I notice in this case you lack the "aggregates" property for the Pivot process. Please try adding "aggregates" and see how it goes:

->pipe(new Pivot([
		'dimensions' => [
			'column' => 'Week1Budget', 'Week2Budget', 'Week3Budget', 'Week4Budget',
			'row' => 'Week1SchedCost', 'Week2SchedCost', 'Week3SchedCost', 'Week4SchedCost'
		],
                "aggregates" => array(
                    "sum" => "field1",
                ),
		
	]));
gkurl commented on May 23, 2019

Hi David,

Sorry for the late reply. I have been trying to implement this. Just a few questions.

Is there a way of implementing multiple sums? So I want to show Week1SchedCost + Week1BudgetCost, and then the same for Week2, Week3 etc...

Can I add prefix, labels etc to columns? I want to show pound symbol and organise table a bit better? How can I add headings etc?

gkurl commented on May 23, 2019

This is how it currently looks - I think I managed to figure out how to get multiple sums, I just pass the column into "sum" as an array. So this is OK. But I still don't get how to better arrange it and show column/row names, change total position, add pound sign etc? Please help.

This is what report currently looks like

Current report code:

<?php
	$index = 2;
	PivotTable::create(array( //use PivotTable widget for Pivot datastore instead of DataTables
		 'name' => 'PivotTable',
		 'dataSource' => function() use ($index) {
		 return $this ->src("datastore" . $index) ->pipe(new Pivot([
		'dimensions' => [
			'column' => ['Week1SchedCost', 'Week2SchedCost', 'Week3SchedCost', 'Week4SchedCost'],
			'row' => ['Week1Budget', 'Week2Budget', 'Week3Budget', 'Week4Budget']
		],
		"aggregates" => [
		
			"sum" => ["Week1Total", "Week2Total"]
		]
		
	]));
	
						}
						//
	));

As you can see, it's lots of numbers everywhere with no clear indication as to what number represents what set of data.

David Winterburn commented on May 24, 2019

Hi,

Please try the these properties for PivotTable to add prefix, symbol, modify column name, etc:

PivotTable::create(array(
    ...
	'map' => array(
		'rowField' => function($rowField, $fieldInfo) {
			return $rowField;
		},
		'columnField' => function($colField, $fieldInfo) {
			return $colField;
		},
		'dataField' => function($dataField, $fieldInfo) {
			$v = $dataField;
			return $v;
		},
		'waitingField' => function($waitingField, $fieldInfo) {
			return $waitingField;
		},
		'rowHeader' => function($rowHeader, $headerInfo) {
			$v = $rowHeader;
			return $v;
		},
		'columnHeader' => function($colHeader, $headerInfo) {
			$v = $colHeader;
			return $v;
		},
		'dataCell' => function($value, $cellInfo) {
			return $value;
		},
	),
	'hideSubTotalRows' => true,
	'hideSubTotalColumns' => true,
    ...
))

Let us know if you need any further information. Thanks!

gkurl commented on May 29, 2019

Hi David,

Thanks for the example - I don't understand the placeholder data however? What is meant to go into "rowField", "rowInfo", "columnField" etc. Could you possibly show me a real example so I can attempt to replicate on mine?

Thanks.

David Winterburn commented on Jun 4, 2019

Hi,

Sorry for the delayed reply! Since you use PivotTable widget, the "rowField", "columnField" and "waitingField" maps don't have any effect. The "dataField" refer to your "Week1Total - sum", "Week2Total - sum". The "rowHeader" are the row labels on the left side and "columnHeader" are the column label at the top. Finally, "dataCell" are the number data section.

In your case, if you want to add the £ symbol to the number there could be 2 methods: 1. Add "prefix" => "£" to "Week1Total" and "Week2Total" column meta before piping Pivot process (using either the ColumnMeta or Map processes):

->pipe(new \koolreport\processes\ColumnMeta([
    "Week1Total" => [
        "type" => "number",
        "prefix" => "£"
    ],
    "Week1Total" => [
        "type" => "number",
        "prefix" => "£"
    ],
]))
->pipe(new \koolreport\pivot\processes\Pivot(...)
  1. Use "dataCell" map:
                'dataCell' => function($value, $cellInfo) {
			return "£ " . $value;
		},

Let us know if there's further difficulties. Thanks!

gkurl commented on Jun 5, 2019

Hey David,

No problem at all, you've been very helpful so far. I will try your above suggestions and will let you know. Thank you.

gkurl commented on Jun 7, 2019

Hi David,

Sorry I am struggling to get this code to compile - could you please provide me a fully working example of above code that you think may work for my columns etc?

Would be appreciated. Thank you.

David Winterburn commented on Jun 10, 2019

Hi,

If you meant the "dataCell" map please try this code:

PivotTable::create(array(
    ...
	'map' => array(
		...
		'dataCell' => function($value, $cellInfo) {
			return "£ " . $value;
		},
	),
    ...
))

Let us know if you need anything else. Thanks!

Build Your Excellent Data Report

Let KoolReport help you to make great reports. It's free & open-source released under MIT license.

Download KoolReport View demo
help needed

None