KoolReport's Forum

Official Support Area, Q&As, Discussions, Suggestions and Bug reports.
Forum's Guidelines

ApexCharts info #3164

Closed John opened this topic on on Oct 4, 2023 - 11 comments

John commented on Oct 4, 2023

I see that you are working on ApexCharts! When will this be ready for us?

KoolReport commented on Oct 12, 2023

We are gradually adding documentation for ApexCharts, you can view here. Currently the package is working well and ready to be used, you can view our example to start using. And if you have any question, please open a topic here.

John commented on Oct 12, 2023

This is perfect, thanks!

John commented on Oct 16, 2023

I've created some apex gauges and they look fine. I can't find how to format the chart title though.. i mean its font size and color.

Sebastian Morales commented on Oct 17, 2023

Pls check this Gauge chart example of ApexCharts and see the code of MyReport.view.php below the page:

https://www.koolreport.com/examples/reports/apexcharts/radialbar_circle/stroked_gauge/

You can customize font and color of dataLabels' name and value there.

John commented on Oct 17, 2023

Thanks. As i understand, in your example you use label instead of title. I have a mysql datasource in dashboard, so how can i use the $data of your example there in order to include 'series-1' and pass my text there?

Sebastian Morales commented on Oct 17, 2023

You can just replace the column names to using yours. For example, if your database table has 2 columns "country" and "population" you can try this:

        \koolreport\apexcharts\RadialBarChart::create(array(
            "dataSource" => $this->dataStore("countryPopulation"),
            "columns" => array(
                "country",
                "population"
            ),
            ...
        ));
John commented on Oct 21, 2023

Thanks, i'll try it. Another question now: is it possible to create a chart like the image below?

I tried using 2 columns (one with negative values) with the combo chart. It was good enough, but i also want to use the stacked bar feature.

Sebastian Morales commented on Oct 23, 2023

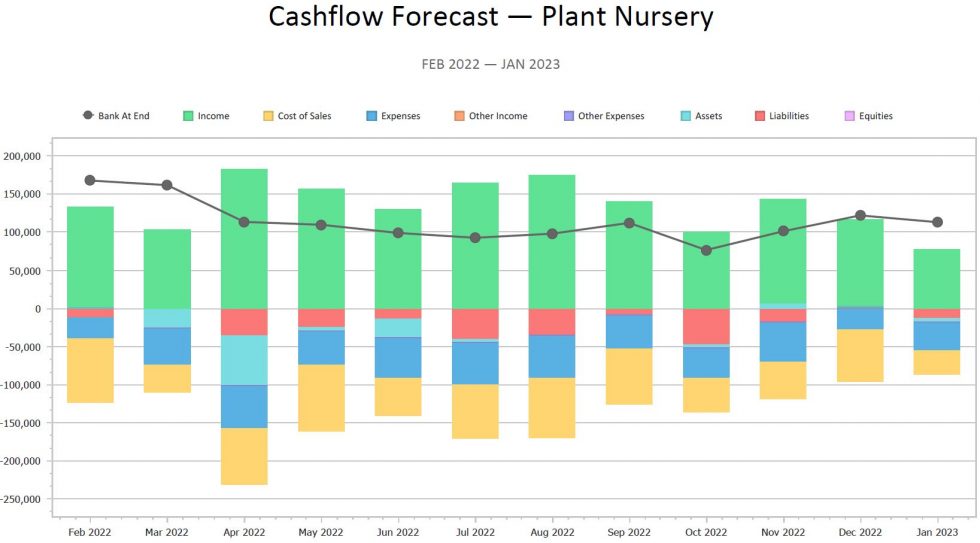
Yes, you can achieve the combo chart of stacked column and line like this:

        \koolreport\apexcharts\ComboChart::create(array(
            ...
            "columns" => array(
                "Date" => [
                    ...
                ],
                "Website Blog" => [
                    "chartType" => "column"
                ],
                "Website News" => [
                    "chartType" => "column",
                ],
                "Social Media" => [
                    "chartType" => "line"
                ]
            ),
            'stacked' => true, 
John commented on Oct 23, 2023

Wow, i had already added this 'stacked' => true but it didn't work. I thought something else was misssing so i asked here... now i modified my data and it worked fine! It was a data issue as i see (there is only something with tooltips but it's ok). Thanks!

John commented on Nov 27, 2023

Hi again, a new one:

How can i implement something like the actionRowSelect($request, $response) in Apexcharts? I mean something like the example in KPI Dashboards / Products where i click on a Donut slice and i get the records on the table beside. I think there is dataPointSelection method but i i couldn't find any documentation... Can you help with a small example?

David Winterburn commented on Nov 28, 2023

Would you pls open a new topic for this question so that other users can find the question and answers more easily in the future? Tks,

Build Your Excellent Data Report

Let KoolReport help you to make great reports. It's free & open-source released under MIT license.

Download KoolReport View demo
None yet

None