KoolReport's Forum

Official Support Area, Q&As, Discussions, Suggestions and Bug reports.
Forum's Guidelines

Google ColumnChart count of - data in a row #3154

Closed John opened this topic on on Sep 25, 2023 - 4 comments

John commented on Sep 25, 2023

I have a mysql database with data in this form:

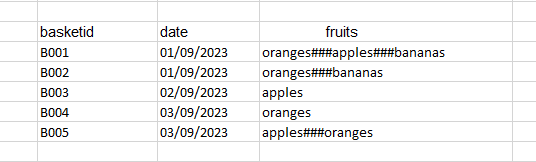
I want to use Google ColumnChart (in Dashboard) to get the count of fruits per fruit in a given period. So the results of the above table for September would be:

oranges 4

apples 3

bananas 2

The difficulty is how to separate fruits to categories, how to split data in fruits column (there is ### between fruits...) in order to show their count in chart columns. Any suggestion?

John commented on Sep 26, 2023

Hi KoolTeam, i wonder if this guide topic could help me > https://www.koolreport.com/forum/topics/2875 If yes, i wish to know how i could configure it to work in Dashboard environment....

John commented on Sep 28, 2023

I added process to my dashboard and made some succesfull tests. But unfortunately the Map or Transpose or other processes i see are not appropriate for my case. For example, i can add columns (from the splitted data from my "fruit" column) but the column chart does not accept it. I think it will if data was in separe rows (as records). Or maybe if chart accepts an array with the new columns from the process? Is there any method to add rows instead of columns? Other suggestion?

John commented on Sep 28, 2023

Ok, i found how to add rows... i'm working on this...

John commented on Sep 29, 2023

Unfortunately adding rows via process is not appropriate for the chart. Do you have any suggestion?

Build Your Excellent Data Report

Let KoolReport help you to make great reports. It's free & open-source released under MIT license.

Download KoolReport View demo
help needed

Dashboard