Official Support Area, Q&As, Discussions, Suggestions and Bug reports.
Forum's Guidelines
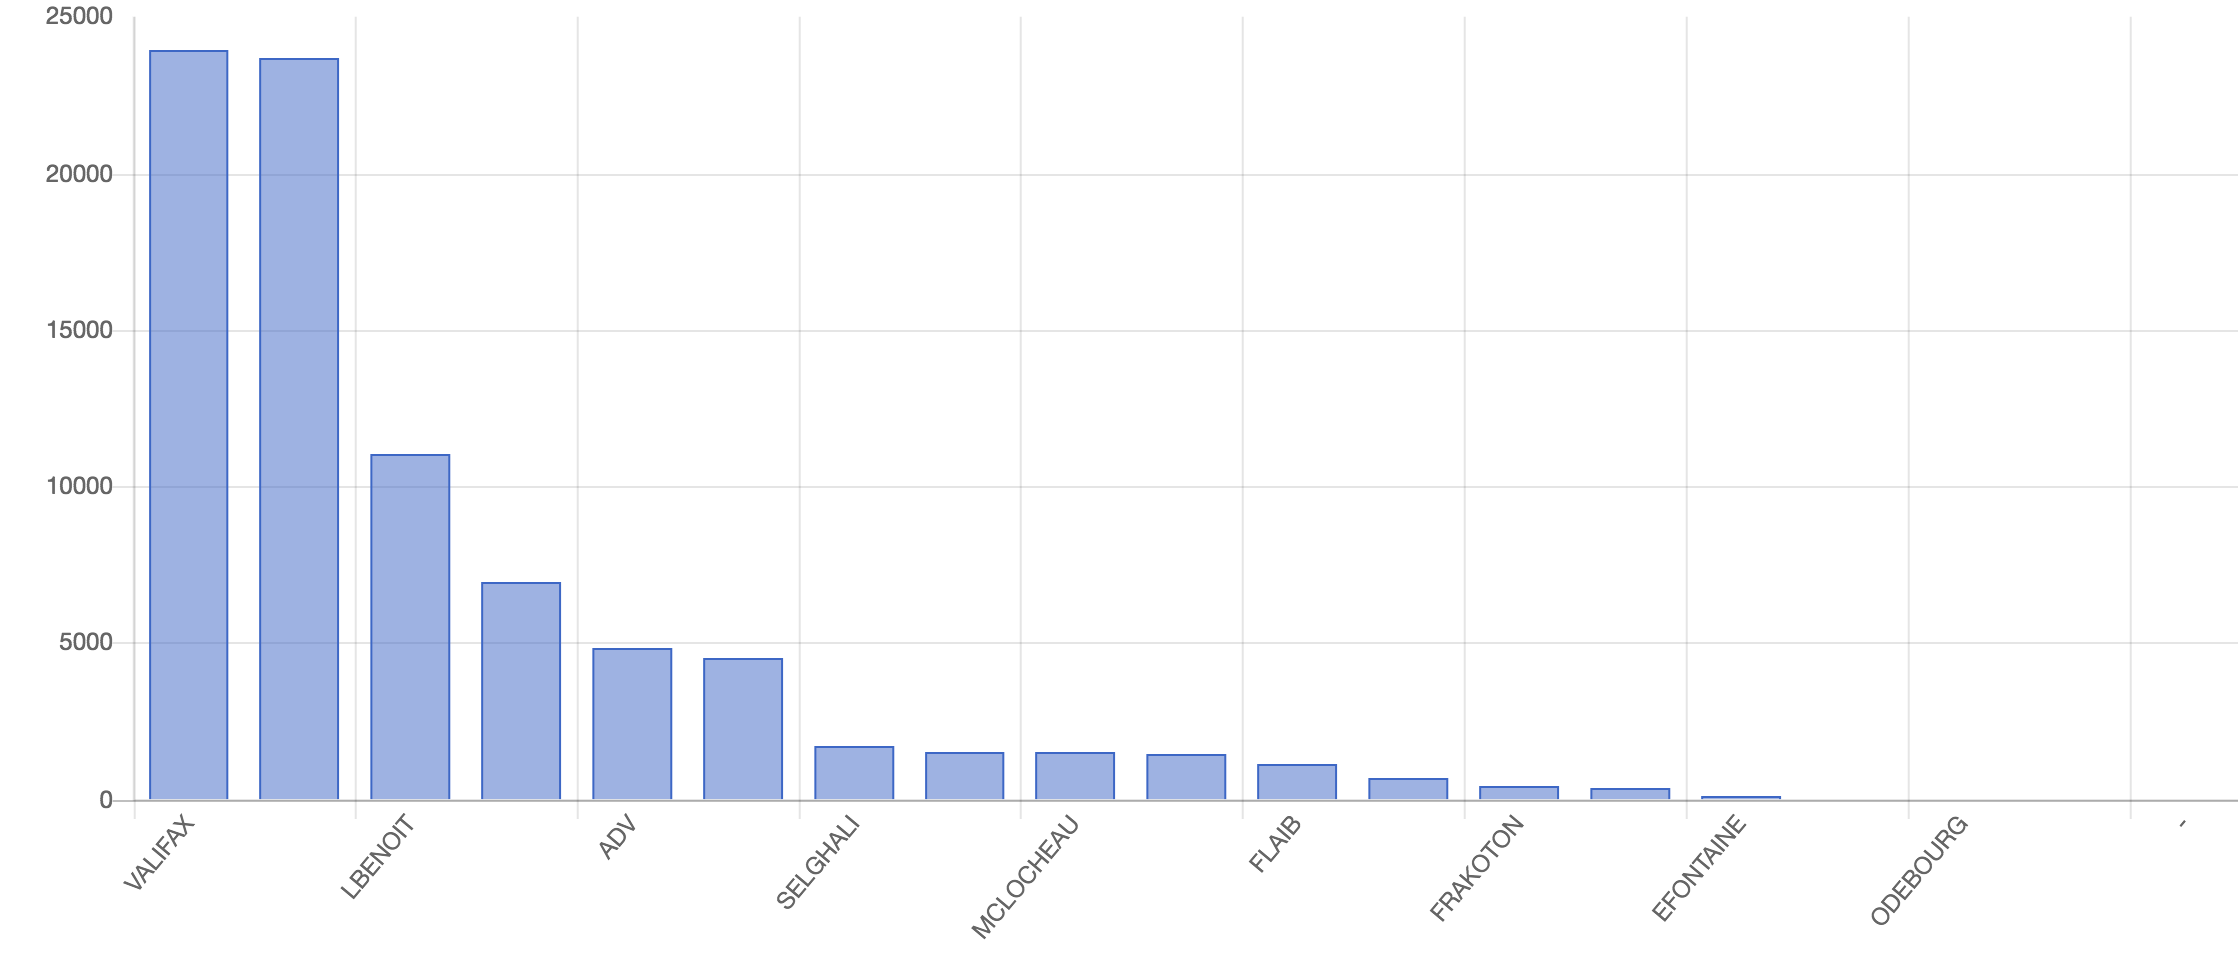
Sorry, it doesn't work. Here is my code :
ColumnChart::create(array(
    "dataSource"=>$this->dataStore("PO"),

    "title"=>"PO Challenge",
    "columns"=>array(
            "salesPerson"=>array(
            "label"=>"sales",
            ),
            "PO"=>array(
            "label"=>"Amount",
            "type"=>"number",
            "config"=>array(
            "backgroundColor"=> "#18249B",
              )
            ),
    ),
"options"=>array(
        "scales"=>array(
            "xAxes"=>array(
                array(
                    "tick"=>array(
                        "autoSkip"=>false
                    )
                )
            )
        )
    )
))
Let KoolReport help you to make great reports. It's free & open-source released under MIT license.
Download KoolReport View demo