KoolReport's Forum

Official Support Area, Q&As, Discussions, Suggestions and Bug reports.
Forum's Guidelines

Datagrid Row Group Show Columns 1-5 collapsed, 6-7 when expanded. #2703

Open George opened this topic on on Jun 3, 2022 - 8 comments

George commented on Jun 3, 2022

Hi,

I'm trying to use datagrids row group column to show column 1-6 when collapsed. and the rest (column 7-8) when expanded. I have a screenshot of what I currently have.

I basically want columns: Date, Child First, Child Last, Location, Room, and Prescreen Status to be on the 'top' row. And the Question and Answer columns in a rowspan to be in the corresponding Expanded rows.

current

code:

"clientRowGroup" => [
    "date_cid" => [
        direction" => "DESC",
        top" => "<td>{row}</td> <td colspan='999'>{expandCollapseIcon} date: {date_cid}    </td>"
    ]
],

Any help is appreciated, thanks!

Sebastian Morales commented on Jun 6, 2022

The principle is that you can only show the current grouped column and parent grouped columns on a group's top or bottom row. Otherwise, for a non-grouped column there could be multiple values per other column's group, the table doesn't know which value should represent the group.

In case your 6 columns' values are the same per date you can create a new column combining the 6 columns (and date as well) then group by that combining column:

//MyReport.php
->pipe(new Map(array(
    "{value}" => function($row) {
        $row["child_info"] = $row["date_cid"] . " : " . $row["first_name"] ...;
        return $row;
    }
)))

//MyReport.view.php
DataTables::create(array(
    ...
    "clientRowGroup" => [
        "child_info" => [
            direction" => "DESC",
            top" => "<td>{row}</td> <td colspan='999'>{expandCollapseIcon} {child_info}    </td>"
        ],
        "columns" => array(
            "child_info" => array("visible" => false),
            "question" => array(),
            "answer" => array(),
        )
    ],
));            
George commented on Jun 6, 2022

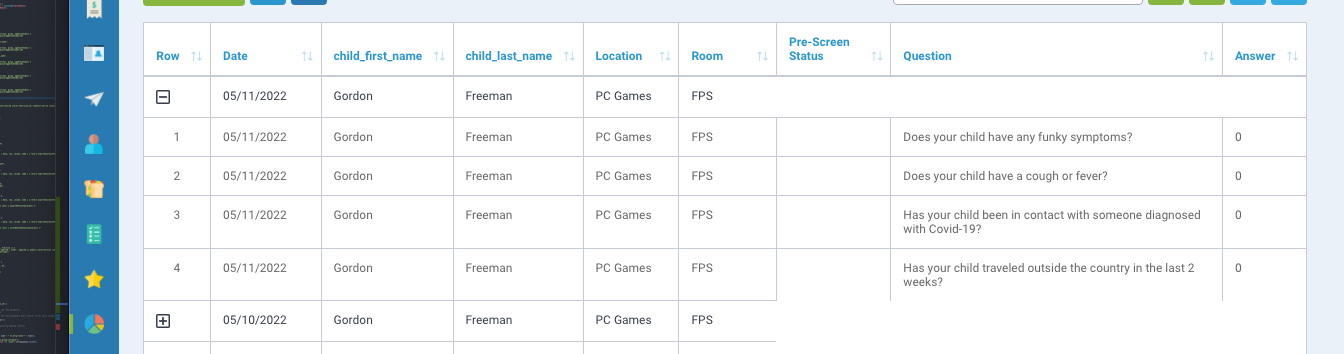
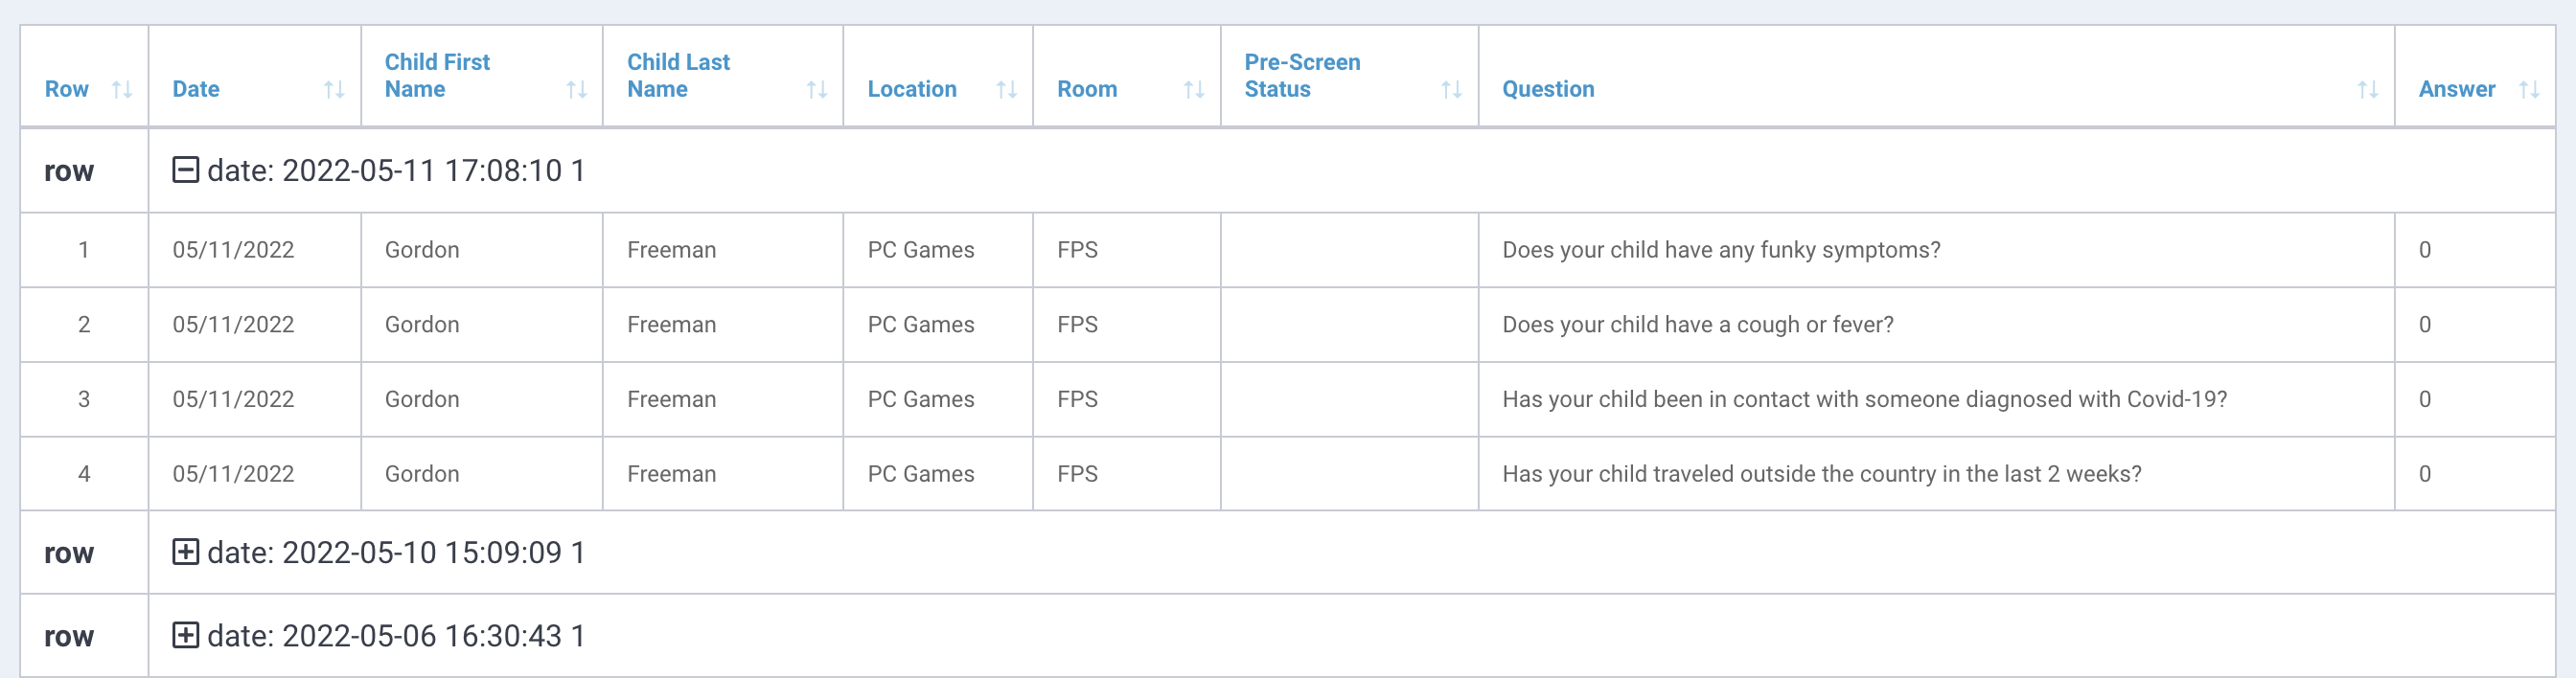
Hey Sebastian, this could work. However I would like to keep the column headers visible at the top of the table. I've managed to get the current columns of the rowgroup in the top with:

"clientRowGroup" => [
                    "date_cid" => [
                        'calculate' => [
                            'first_name' => [
                                "aggregate" => "function(rows, group, aggFieldIndex) {
                                    return rows.data().pluck(aggFieldIndex)[0]
                                }
                                ",
                                 'field' => 'child_first_name',
                            ],
                            'last_name' => [
                                "aggregate" => "function(rows, group, aggFieldIndex) {
                                    return rows.data().pluck(aggFieldIndex)[0]
                                }
                                ",
                                 'field' => 'child_last_name',
                            ],
                            'date' => [
                                "aggregate" => "function(rows, group, aggFieldIndex) {
                                    return rows.data().pluck(aggFieldIndex)[0]
                                }
                                ",
                                 'field' => 'Date',
                            ],
                            'location' => [
                                "aggregate" => "function(rows, group, aggFieldIndex) {
                                    return rows.data().pluck(aggFieldIndex)[0]
                                }
                                ",
                                 'field' => 'Location',
                            ],
                            'room' => [
                                "aggregate" => "function(rows, group, aggFieldIndex) {
                                    return rows.data().pluck(aggFieldIndex)[0]
                                }
                                ",
                                 'field' => 'Room',
                            ],
                        ],
                        "direction" => "DESC",
                        "top" => "<td>{#}{expandCollapseIcon}</td><td style='font-size:12;'>{date}</td><td style='font-size:12;'>{first_name}</td><td style='font-size:12;'>{last_name}</td><td style='font-size:12;'>{location}</td><td style='font-size:12;'>{room}</td>"
                    ]
                ],

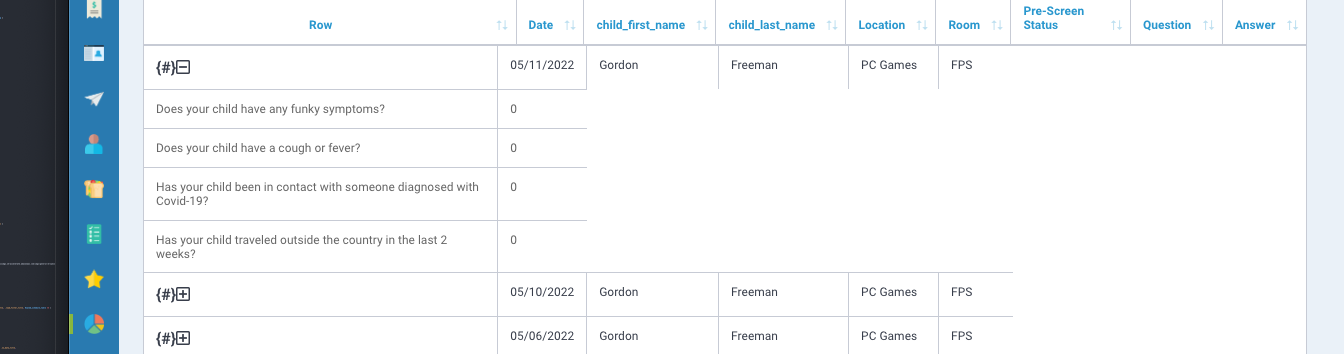
Now I need to only show the question and answer columns when expanded. Is there a way to do a colspan for specific columns?

George commented on Jun 6, 2022

I've added a condition for the specific cells that arent Question and Answer in the cssClass with

                    'td'    => function ($row, $colName) {
                        $hide_cell = $colName == "Question" || $colName == "Answer" ? "" : "hide_cell";
                        $className = str_replace(' ', '-', strtolower($colName));
                        return "reportTableCell {$className} {$hide_cell}";
                    },
//css
.hide_cell{
    display: none;
}

and i can hide the correct cells. But my styling is a bit off. Any idea on how i can expand the colspan of the Question column? I would also like to make sure the row column header doesnt expand with the td cell.

Sebastian Morales commented on Jun 7, 2022

That's one great solution you implemented there, George! For column td's colspan, you could try DataTables' "attributes" property to customize:

https://www.koolreport.com/docs/datagrid/datatables/#custom-attributes

Let us know if it works for you. Rgds,

George commented on Jun 7, 2022

Hi, the attributes property worked perfectly thank you.

I have two more issues:

1 . Row number by Group. In the previous screenshot I have a '{#}' place holder for row number. Is it possible to show the row numbers by group instead of the individual row? I was trying to find a way with the 'calculate' option but it only returns the individual row data so I cant calculate the index of the row group.

                            'row_num' => [
                                "aggregate" => "function(rows, group, aggFieldIndex) {
                                    console.log(rows)
                                    return 'test'
                                }
                                "
                            ],
                            'field' => 'Row',

2 . hide the expand/collapse button and change the whole row to expand/collapse on click.

As always thanks for the assistance.

Sebastian Morales commented on Jun 8, 2022

Here are solutions for your requirement:

1 . Use this aggregate function instead:

                "clientRowGroup" => [
                    ...
                    "customerName" => [...], // level 1 groups
                    "productLine" => [ // level 2 groups
                        ...
                            'dtgroups_level2_count' => [
                                'field' => 'dollar_sales',
                                "aggregate" => "function(rows, group, aggFieldIndex) {
                                    // there's one hidden 'level' variable indicating which level variable 'group' is
                                    if (level != 1) return; // don't count variable 'group' if it's not level 2 (index 1)
                                    if (!window.dtGroups_level2) window.dtGroups_level2 = [];
                                    if (window.dtGroups_level2.indexOf(group) === -1) window.dtGroups_level2.push(group);
                                    return window.dtGroups_level2.length;
                                }",
                            ], 
                        ],
                        "top" => "<td colspan='999'>{expandCollapseIcon} {dtgroups_level2_count}...</td>",

2 . Use an onclick for the group td to call expand/collapse buttons while hiding the buttons:

        <script>
            function expandCollapseGroup(el) {
                if (typeof expandCollapse !== 'undefined') return; // needs this since evoking expand/collapse icons' click can trigger this td's onclick function as well. We only want this function to run once.
                expandCollapse = true;
                var expandIcon = el.querySelector("span.group-expand");
                if (expandIcon && expandIcon.style.display !== 'none') expandIcon.click();
                else {
                    var collapseIcon = el.querySelector("span.group-collapse");
                    if (collapseIcon && collapseIcon.style.display !== 'none') collapseIcon.click();
                }
                delete expandCollapse;
            }
        </script>
<?php
    DataTables::create(array(
        ...
        "clientRowGroup" => array(
            ...
                        "top" => "<td colspan='999' onclick=\"expandCollapseGroup(this);\"><span style='display:none'>{expandCollapseIcon}</span> {dtgroups_level2_count}...</td>",

Hope this helps.

George commented on Jun 8, 2022

Hey Sebastian, almost there. issue number 2 is solved.

However for the row number issue the row num seems to set all rows to the number of rows on the current page. My table only has one group level so I changed all instances of 2 to 1.

                            'dtgroups_level1_count' => [
                                'field' => 'Row',
                                "aggregate" => "function(rows, group, aggFieldIndex) {
                                    // there's one hidden 'level' variable indicating which level variable 'group' is
                                    if (level != 0) return; // don't count variable 'group' if it's not level 2 (index 1)
                                    if (!window.dtGroups_level1) window.dtGroups_level1 = [];
                                    if (window.dtGroups_level1.indexOf(group) === -1) window.dtGroups_level1.push(group);
                                    console.log(window.dtGroups_level1.length)
                                    return window.dtGroups_level1.length;
                                }",
                            ], 
],
                        "top" => "<td style='width:50px;'>{expandCollapseIcon} {dtgroups_level1_count}</td><td  style='font-size:12;'>{date}</td><td style='font-size:12;'>{first_name}</td><td style='font-size:12;'>{last_name}</td><td style='font-size:12;'>{location}</td><td style='font-size:12;'>{room}</td><td style='font-weight:bold;font-size:12;color:{prescreen_status_color}'>{prescreen_status}</td>"

Also I noticed that when I change the paging to the next page, all the rows default to expanded. And when switching back from page 2 to page 1, Page 1 will have the row numbers from page 2. I should note I have a collapseAllGroups function that runs when 'onReady' runs.

//onReady
                    reportTable.on( 'draw', function () {
                        collapseAllGroups('reportTable', 0);
                    } );
                    collapseAllGroups('reportTable', 0);

//CollapseAllGroups function, in <script> at bottom of file
    function collapseAllGroups(name, level) {
        var allGroups = document.querySelectorAll("#" + name + " tr.dtrg-level-" + level);
        allGroups.forEach(group => {
            var collapseIcon = group.querySelector("span.group-collapse");
            if (collapseIcon && collapseIcon.style.display !== 'none') collapseIcon.click();
        });
    }

George commented on Jun 8, 2022

Sorry above issue has been solved, there was some other code messing with your function.

Build Your Excellent Data Report

Let KoolReport help you to make great reports. It's free & open-source released under MIT license.

Download KoolReport View demo
help needed

DataGrid