KoolReport's Forum

Official Support Area, Q&As, Discussions, Suggestions and Bug reports.
Forum's Guidelines

How to write query in value metric #2125

Closed Komuraiah A opened this topic on on Jun 3, 2021 - 13 comments

Komuraiah A commented on Jun 3, 2021

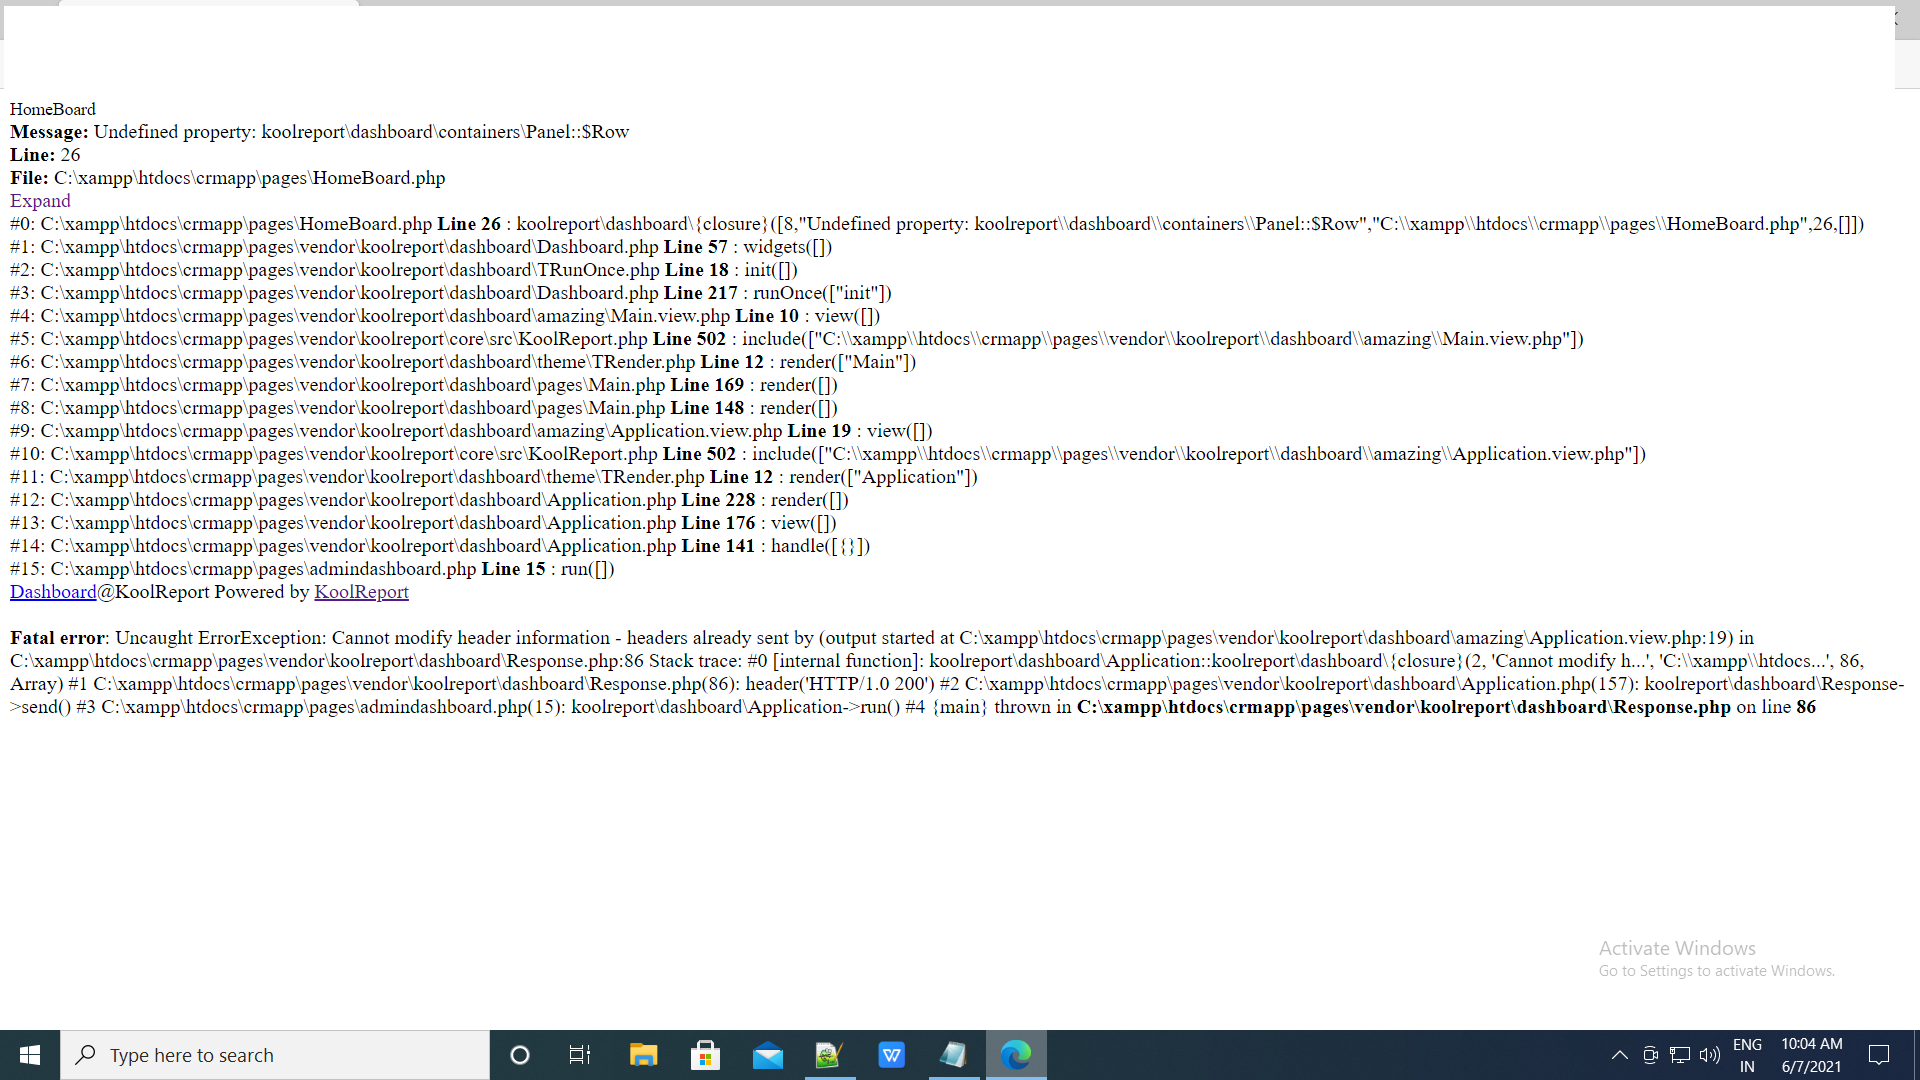
Dear Team, I need a small help on how to write a query in value metrics function. And below is my requirement.

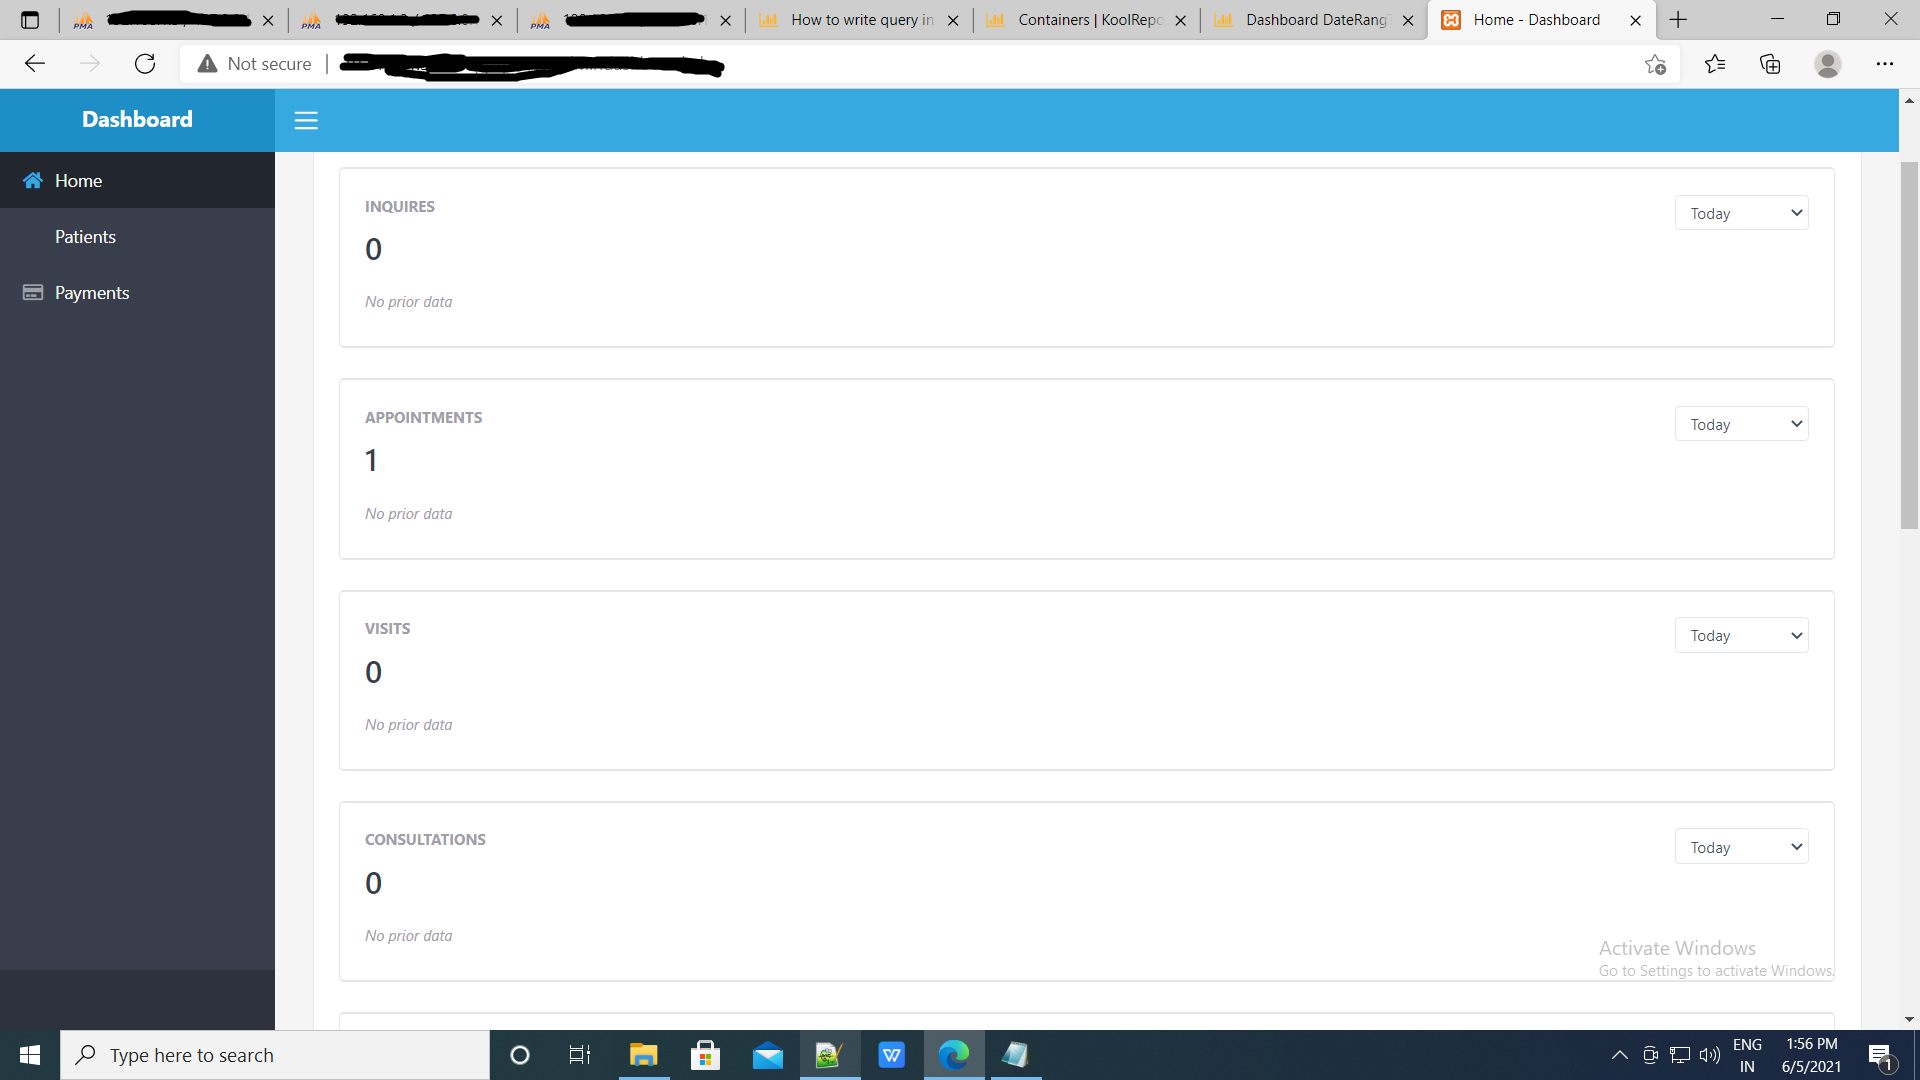
I need to display the sum/count of the payment done by different payment modes like cash,card and cheque by value metrics functionality.

payment type (column name) and we will store the id of different payment types like 1(id) - cash, 2(id) - card and 3(id) - cheque.

And for that i need to join the above table with other table to print the name of the payment type.

so now how can i implement the above requirement for value metric functionality.

<?php

use \koolreport\dashboard\metrics\Value;
use \koolreport\dashboard\fields\Date;
use \koolreport\dashboard\fields\Number;

class PaymentTable extends Value
{
    protected function dataSource()
    {
        return AutoMaker::table("table name");
    }

    protected function fields()
    {
        return [
            Date::create("Cloumn name"),
            $this->sum(
                Number::create("Cloumn name")
            ),
			$this->sum(
                Number::create("Cloumn name")
            ),
        ];
	
    }
	
}

Please help me

Komuraiah A commented on Jun 3, 2021

Dear Team, Can I expect a reply from you people. or else still i need to wait?

Komuraiah A commented on Jun 3, 2021

Hey you supporting team are you hearing my issue or not. Can I expect a reply from you people. or else still i need to wait?

KoolReport commented on Jun 3, 2021

So if you want to show value of a specific method like cash for example, you can do query something like

protected function dataSource()
{
    return AutoMaker::table("payments")
                ->select("paymentDate","amount")
                ->where("paymentType",1); //1 for cash
}

In the fields, you have a column for date, and another to sum the amount:

protected function fields()
{
    return [
        Date::create("paymentDate"),
        $this->sum(
            Number::create("amount")
        ),
    ];
}
Abhishek commented on Jun 4, 2021

Dear Team, Thanks for the solutions and the above code had worked and able to produce the desire output.

Abhishek commented on Jun 5, 2021

Dear Team, When I am implementing the panel concept for group of value metrics it is now showing in adjacent format.

Cloud you please help me on how correct my code to display the value metrics in adjacent of panel. And the code is below.

how make them adjacent in a panel and not like in the image below.

HomeBoard.php

Row::create([
			Panel::create()->header("Patient Statistics")->type("primary")->sub([
			    inquires::create()->width(1/6),
				appointments::create()->width(1/6),
                visits::create()->width(1/6),
                consultations::create()->width(1/6),
				registrations::create()->width(1/6),
				renewals::create()->width(1/6)
            ])
			]),

KoolReport commented on Jun 5, 2021

Please put the Panel first then the Row and then those 6 metrics under the Row.

Abhishek commented on Jun 6, 2021

Dear Team, Thanks for the solutions and I do have any other query that is I have implemented a column chart in the dashboard but there are some of the conditions that need to satisfy.

  1. Count of inquiries, appointments, visits, and consultations based on individual branches need to be shown in the chart.

  2. I need to join data from different tables like branches from table branch, inquiries from table customer inquiries.

  3. appointments, visits, and consultations from table consultations.

So, can you please help me with how to join the three tables(branch, customer inquiries, consultations) and need to show the count data of inquiries, appointments, visits, and consultations based on individual branches.

I have used only one table in my code but i need to join 3 tables as specified above please help me on how join them.

Branchdata.php

<?php
use \koolreport\dashboard\widgets\google\BarChart;
//use \koolreport\dashboard\fields\Date;
use \koolreport\dashboard\fields\Text;
use \koolreport\dashboard\fields\Number;


class branchdata extends BarChart
{
	protected function onCreated()
    {
        $this
        ->title("Registrations by individual branch")
        ->options([
            "isStacked"=>true
        ]);
        //->colorScheme(["#000","#444","#888"])
        //->height("320px");
    }
	
    protected function dataSource()
    {
        return AutoMaker::table("tblcustomerenquiries")
                ->groupBy("custBranchId")
                ->select("custBranchId")
                ->sum("custRegistrationId")->alias("registrations")
				->sum("custEnquiryId")->alias("inquires");
    }

    protected function fields()
    {
        return [
            Number::create("custBranchId"),
            Number::create("registrations"),
			Number::create("inquires"),
        ];
    }
}
Abhishek commented on Jun 7, 2021

Dear Team, Please help me with how to join various tables in the dashboard chart.

Abhishek commented on Jun 7, 2021

Dear Team, As per you instructions I have implemented the code but it not worked out.

Panel::create()->header("Patient Statistics")->type("primary")->Row::create([
			sub([inquires::create(),
				appointments::create(),
                visits::create(),
                consultations::create(),
				registrations::create(),
				renewals::create(),
            ])
			]),

Error for above code

KoolReport commented on Jun 7, 2021

Row is not function, it is like this:

Panel::create()->sub([
    Row::create([
        inquires::create()->width(1/6),
        appointments::create()->width(1/6),
        visits::create()->width(1/6),
        consultations::create()->width(1/6),
        registrations::create()->width(1/6),
        renewals::create()->width(1/6)
    ])
])
Abhishek commented on Jun 7, 2021

Dear Team please help me for the following issue https://www.koolreport.com/forum/topics/2125#p11385

KoolReport commented on Jun 7, 2021

Have you been able to show the issue regarding the "value metric". If yes, you can close this topic and open a new one with new issue. We limit 1 issue per 1 topic. It will help us to easier tackle issue one by one and other to search for issue and answer.

Abhishek commented on Jun 7, 2021

Dear Team, I am really sorry for the issues and now I have raised the separate ticket for the above issue.

Build Your Excellent Data Report

Let KoolReport help you to make great reports. It's free & open-source released under MIT license.

Download KoolReport View demo
help needed
solved

Dashboard