KoolReport's Forum
Official Support Area, Q&As, Discussions, Suggestions and Bug reports.
Forum's Guidelines
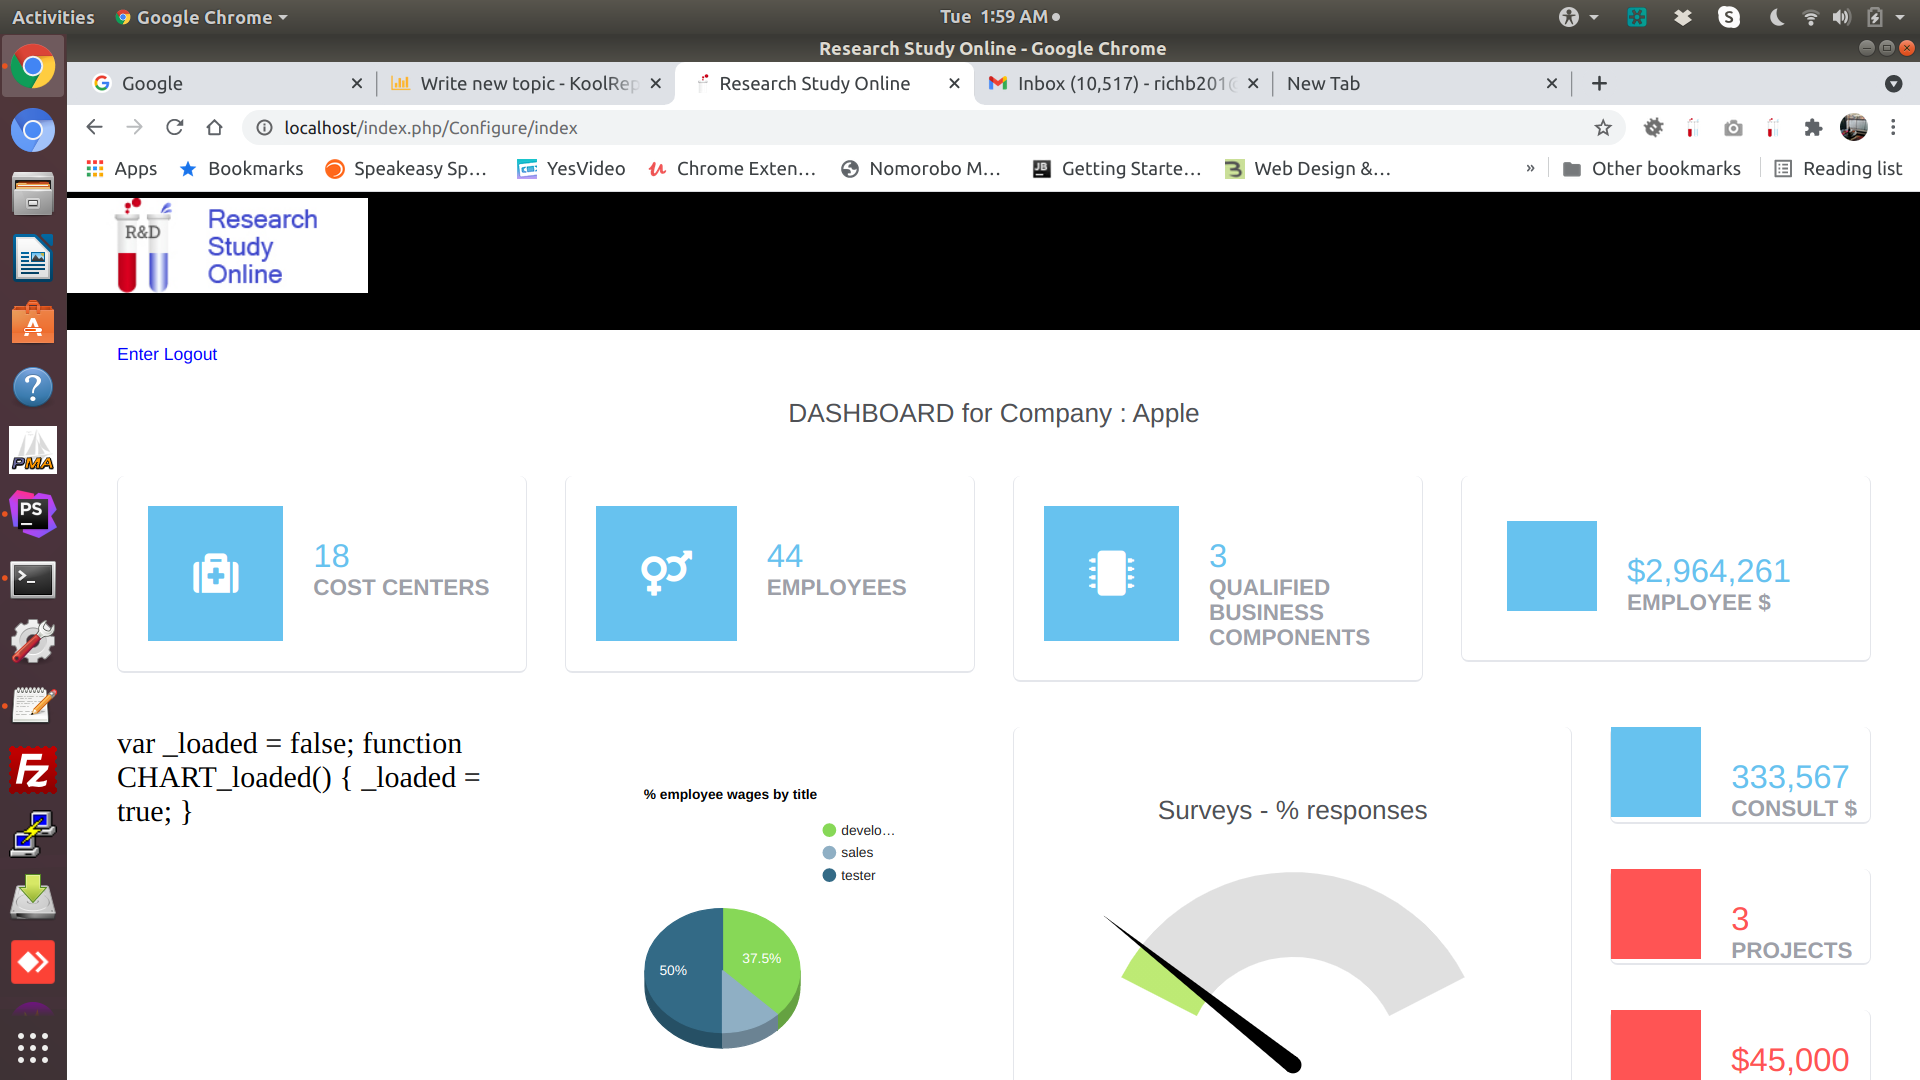
Bug found #2025
//for 3way pie chart by employee count
$sql="
SELECT t.title, t.employee_count
FROM titles as t
WHERE t.email='$email' AND t.campaign= '$campaign'
ORDER BY t.title ASC
";
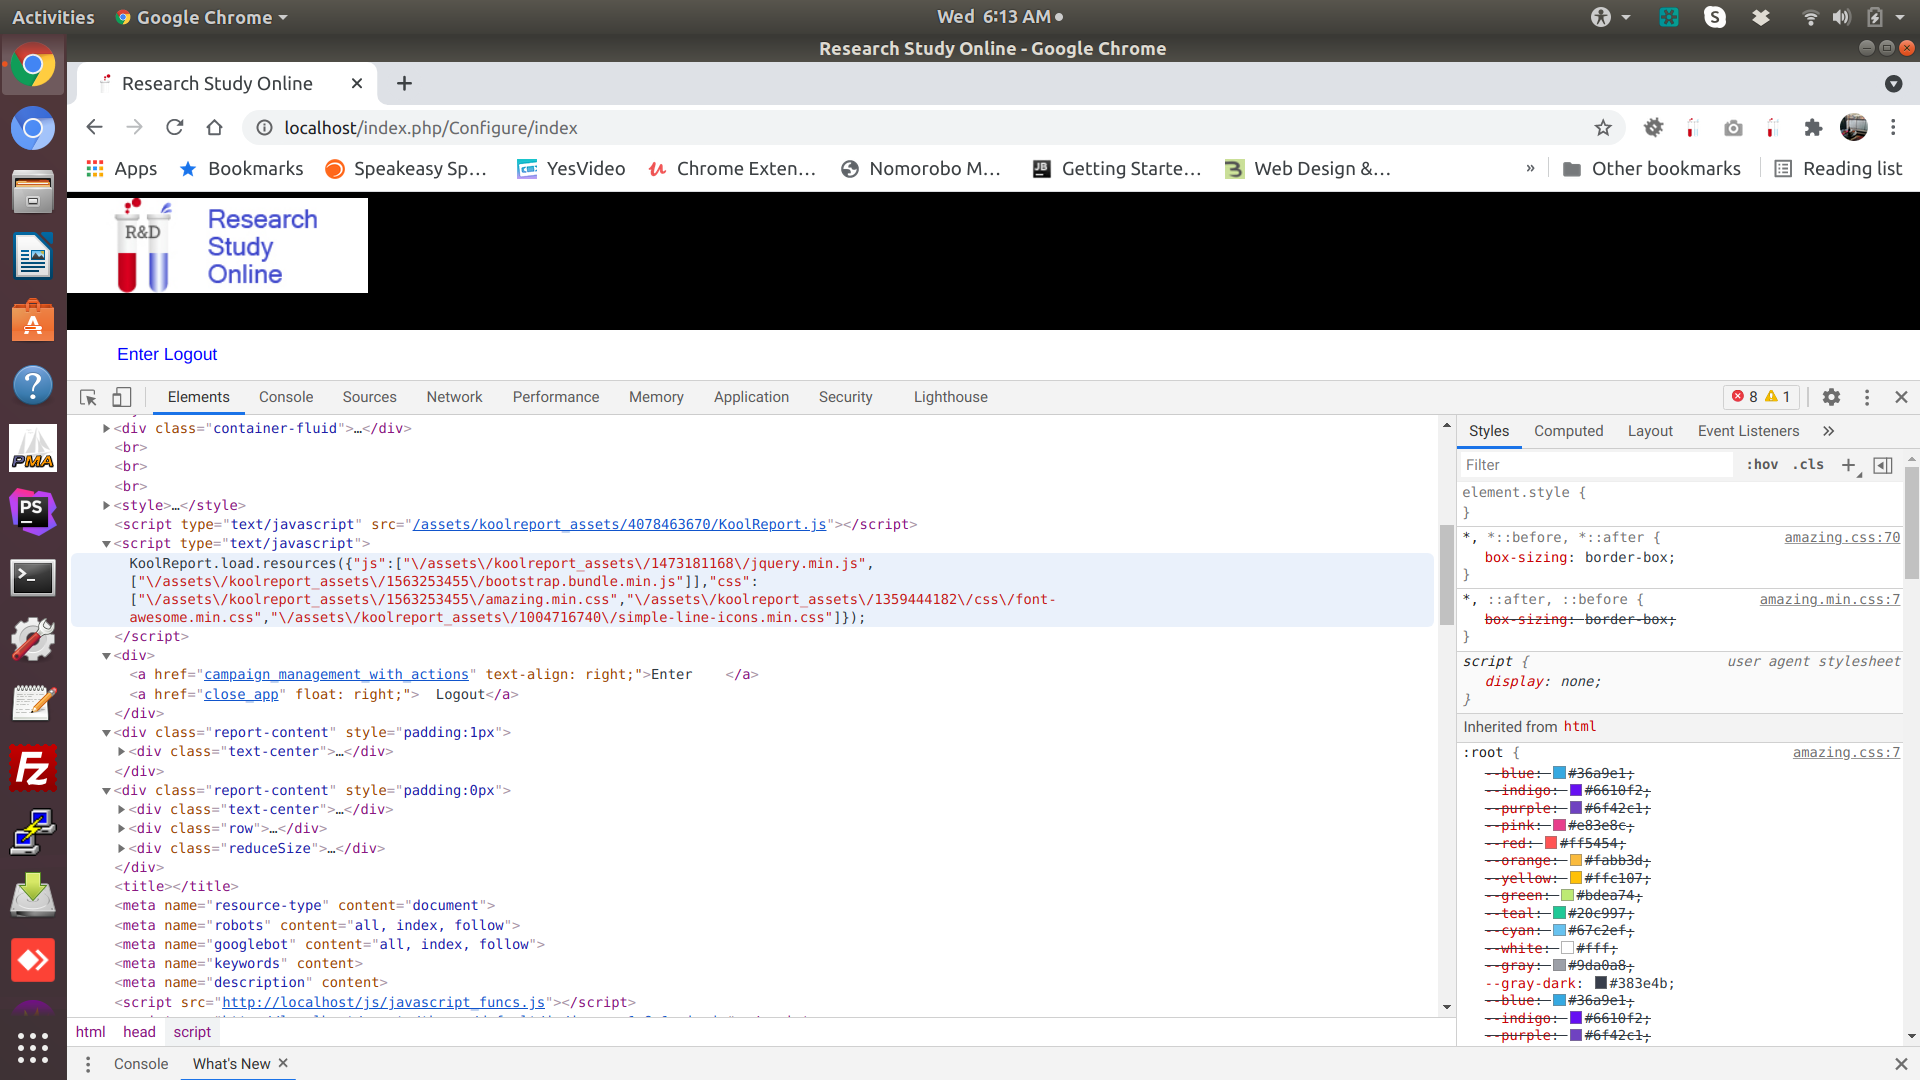
$this->src('substantiator')
->query($sql)
->pipe($this->dataStore("titles_pie"));
// 3 way pie chart by $
$sql="
SELECT t.risk, SUM(e.w2_wages) as total_wages
FROM employees e
JOIN titles t ON e.employee_title=t.title
WHERE e.campaign='$campaign'AND e.email='$email'
GROUP BY risk;
";
$this->src('substantiator')
->query($sql)
->pipe($this->dataStore("titles_pie2"));
}
and the .view
    <div class="row">
        <div class="col-lg-3">
            <?php
            PieChart::create(array(
                    "title"=>"% of total wages by risk",
                    "dataSource"=>$this->dataStore("titles_pie2"),
                    "columns"=>array("risk","total_wages"),
                    "options"=>array("is3D"=>true,"forceIFrame"=>true)
                )
            );
            ?>
        </div>

        <div class="col-lg-3">
            <?php
            PieChart::create(array(
                    "title"=>"% employee wages by title",
                    "dataSource"=>$this->dataStore("titles_pie"),
                    "columns"=>array("title","employee_count"),
                    "options"=>array("is3D"=>true),
                    "forceIFrame"=>true
                )
            );
            ?>
        </div>
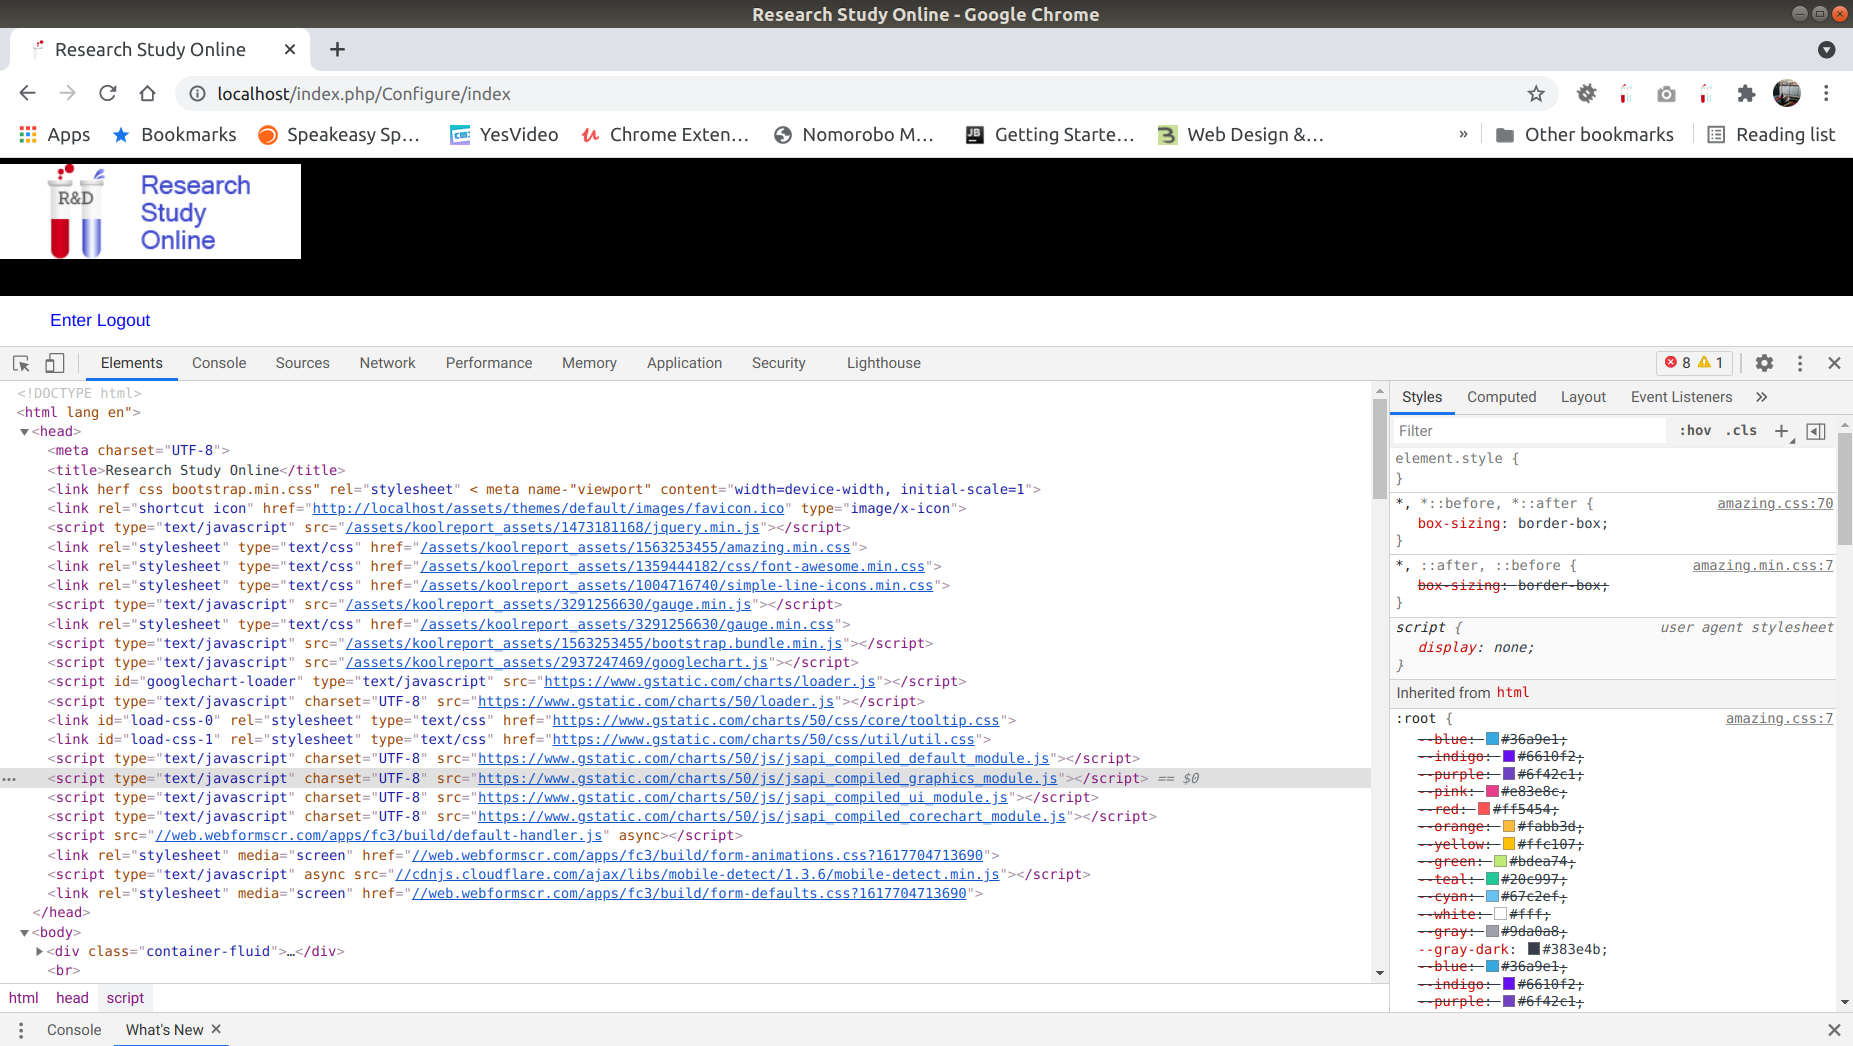
I can confirm this is a Google Charts bug. The exact same string showed up in my directly-used Google Charts Gauge components a few days ago. I found your post with a Google search. I can't find anywhere that has provided a workaround yet, we need to get Google to fix this ASAP.
http://mike-land.com/Solar_Hua_Hin/solar_hua_hin.html
Thank you Michael to file a issue there. The workaround for this issue in KoolReport will be:
- Locate the file
koolreport/core/widgets/google/Chart.php - Change
$stability = "current";to$stability = "49";
Basically we fix the version of library to 49 and avoid using current version of google chart.
Thank you very much.
Build Your Excellent Data Report
Let KoolReport help you to make great reports. It's free & open-source released under MIT license.
Download KoolReport View demo