Hello , I have to draw the selected gangue chart which takes 3 elements: As shown in the picture 1 and 3. I am able to draw the overall layout as shown in picture 2 using 3 stacked charts using chart js overlap chart. But i am facing these two issues: 
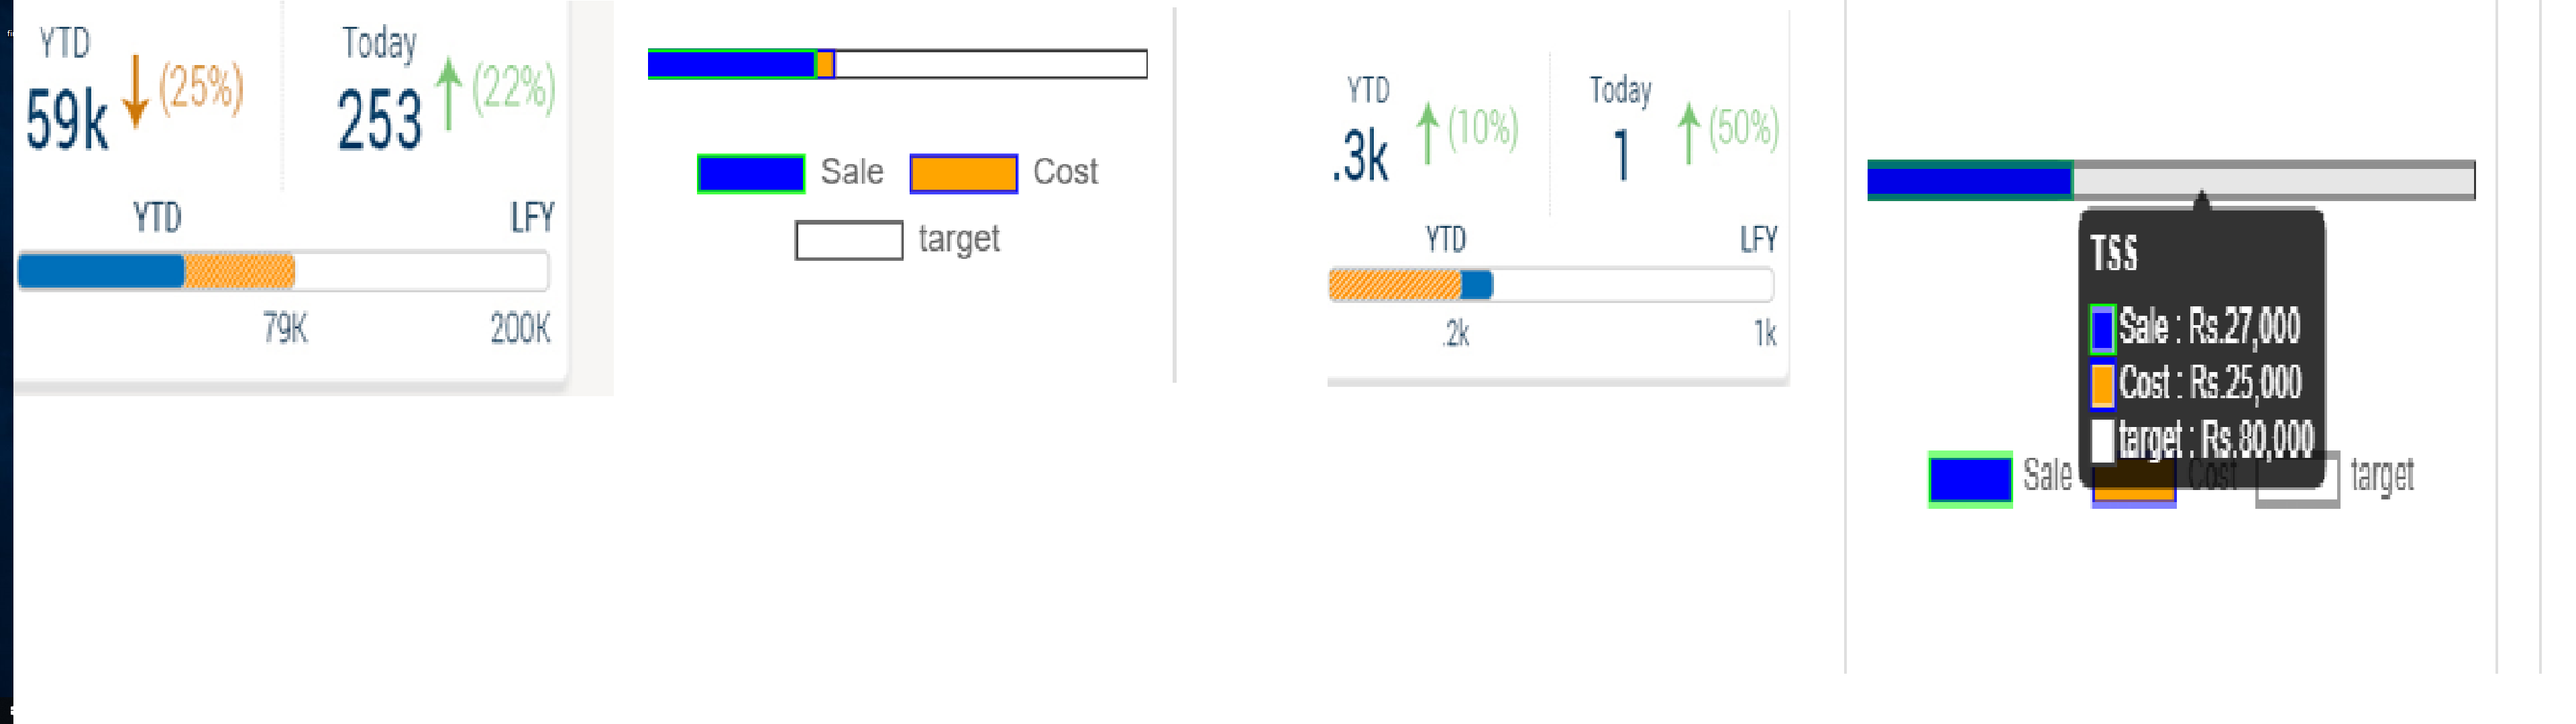
. Like you can see in the fourth image, when the sale value crosses the cost , my blue crosses the orange while i want something as in picture 3. . I want the axis labels to show only those values for which there is data : like 79k and 200k. How do i achieve it?

Here is the code used:

  <?php
                                \koolreport\chartjs\BarChart::create(array(
                                    "dataSource"=> array(
                                        array("category"=>"TSS","sale"=>27000,"cost"=>25000,"target"=>80000,"profit"=>3000)
                                    ),
                                    "dataset"=>array(
                                        "barPercentage"=>0.9,
                                        "categoryPercentage"=> 0.8,
                                        "barThickness" =>12,
                                    ),
                                    "columns"=>array(
                                        "category",
                                        "sale"=>array(
                                            "label"=>"Sale",
                                            "type"=>"number",
                                            "prefix"=>"Rs.",
                                            "config"=>array(
                                                "yAxisID"=>"bar-y-sale",
                                                "backgroundColor"=>"#0000ff",
                                            )
                                        ),
                                        "cost"=>array(
                                            "label"=>"Cost",
                                            "type"=>"number",
                                            "prefix"=>"Rs.",
                                            "config"=>array(
                                                "yAxisID"=>"bar-y-cost",
                                                "backgroundColor"=>"#ffa500",
                                            )
                                        ),
                                        "target"=>array(
                                            "label"=>"target",
                                            "type"=>"number",
                                            "prefix"=>"Rs.",
                                            "config"=>array(
                                                "yAxisID"=>"bar-y-target",
                                                "backgroundColor"=>"#ffffff"

                                            )
                                        )
                                    ),
                                    "options"=>array(
                                        "scales"=>array(
                                            "display"=>false,
                                            "yAxes"=>array(
                                                array(
                                                    "display"=>false,
                                                    "stacked"=>true,
                                                    "id"=>"bar-y-sale",
                                                    "barThickness" =>10,
                                                    "gridLines"=>array(
                                                        "display"=>false
                                                    )
                                                ),
                                                array(
                                                    "stacked"=>true,
                                                    "barThickness" =>10,
                                                    "id"=>"bar-y-cost",
                                                    "display"=>false,
                                                    "type"=>"category",
                                                    "offset"=>true,
                                                ),
                                                array(
                                                    "display"=>false,
                                                    "stacked"=>true,
                                                    "barThickness" =>10,
                                                    "id"=>"bar-y-target",
                                                    "display"=>false,
                                                    "type"=>"category",
                                                    "offset"=>true,
                                                ),
                                            ),
                                            "xAxes"=>array(
                                                array(
                                                    "stacked"=>false,
                                                    "display"=>true,
                                                    "gridLines"=>array(
                                                        "display"=>false
                                                    ),
                                                    "ticks"=>array(
                                                        "display"=>true,
                                                        "suggestedMin"=>0,
                                                        "stepValue"=>100
                                                    )
                                                ),
                                                )
                                                ),
                                                "legend"=>array(
                                                    "position"=>'bottom',
                                                    "display"=>true
                                                ),
                                            ),
                                            "responsive"=>'true',
                                            "maintainAspectRatio"=>'true',
                                ));?>