KoolReport's Forum
Official Support Area, Q&As, Discussions, Suggestions and Bug reports.
Forum's Guidelines
Cube and chartjs options #1141
Closed pargibay opened this topic on on Oct 31, 2019 - 21 commentsHi,
Which column setting did you want to use? For Chartjs, we have the columns property to set up columns to draw and their setting. Here's an example:
             LineChart::create(array(
                "title"=>"Stepped Line Chart",
                "dataSource"=>$time_sale,
                "columns"=>array(
                    "month",
                    "sale"=>array(
                        "label"=>"Sale",
                        "type"=>"number",
                        "prefix"=>"$",
                        "config"=>array(
                            "steppedLine"=>true,
                        )
                    ),
                ),
            ));
Let us know if you want something else. Thanks!
Hi pargibay, you can get all columns name from dataStore, for example:
$columnNames = array_keys($this->dataStore("data-from-cube")->meta()["columns"]);
Now with all the name, you can construct a "columns" array:
$columns = array();
foreach($columnNames as $name)
{
    $columns[$name] = array(
        "label"=>ucfirst($name)
    );
}
Basically you can base on the name to add customized property for each columns and then later you can put into any widget of KoolReport:
LineChart::create(array(
    "dataSource"=>$this->dataStore("data-from-cube"),
    "columns"=>$columns
));
Hope that helps.
Hi, Of course:
$this->src("mssql")->query("SELECT m.code AS codigo,FORMAT(pk.prday,'yy-MM-dd') AS fecha,m.name AS producto,ROUND(pk.nominal, 2) AS kg_un,SUM(1) AS cantidad,ROUND(SUM(pk.nominal), 2) AS Kgs, ROUND(100 * AVG((pk.weight - pk.nominal)/ pk.nominal), 2) AS overweight FROM dbo.proc_packs AS pk INNER JOIN dbo.proc_materials AS m ON pk.material = m.material INNER JOIN dbo.proc_lots AS l ON pk.lot = l.lot WHERE (pk.prday BETWEEN CONVERT(datetime,:start,21) AND CONVERT(datetime,:end,21)) AND (pk.rtype <> 4) AND (m.code > '800000') AND m.name IN :products GROUP BY m.code, m.name, pk.prday, pk.nominal ORDER BY pk.prday")
->params(array(
            ":start"=>$this->params["dateRange"][0],
            ":end"=>$this->params["dateRange"][1],
            ":products"=>$this->params["products"],
        ))
->pipe(new Cube(array(
    "row"=>"fecha",
    "columns"=>"producto",
    "sum"=>"overweight",
)))
->pipe(new RemoveColumn(array(
      "{{all}}"
    )))
->pipe($this->dataStore('overweight'));
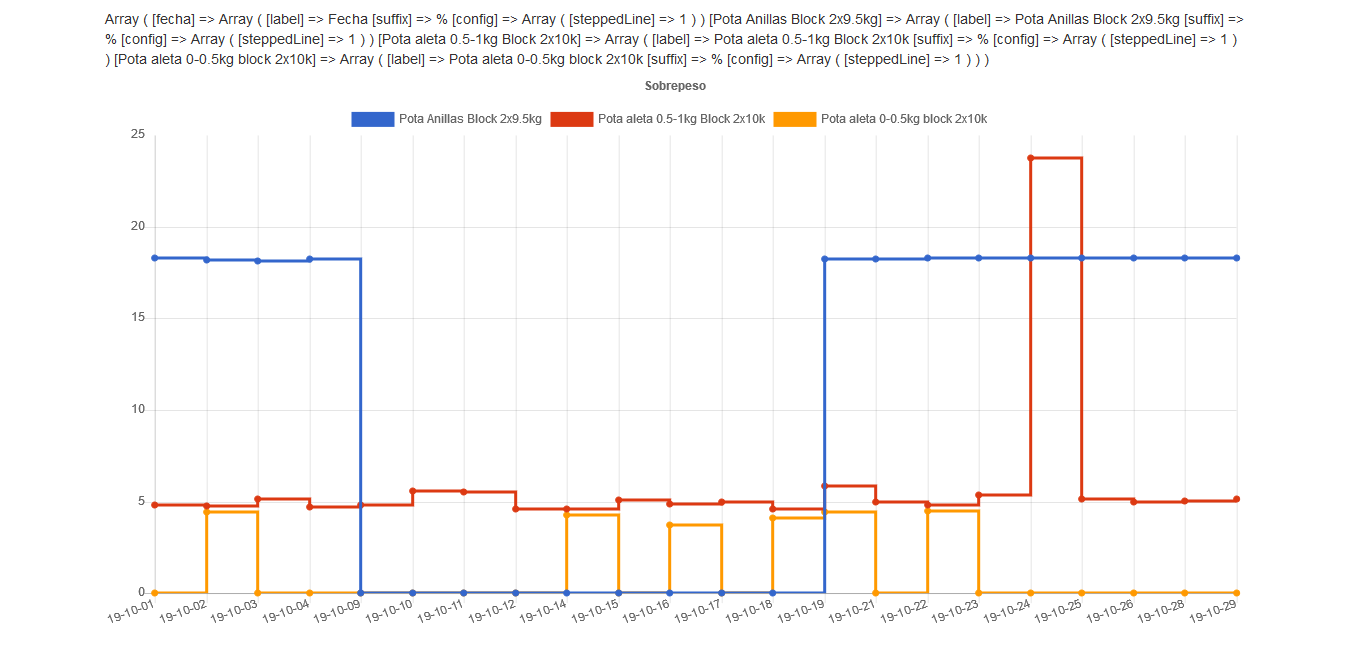
the view
$columnNames = array_keys($this->dataStore("overweight")->meta()["columns"]);
$columns = array();
foreach($columnNames as $name)
{
$columns[$name] = array(
"label"=>ucfirst($name),
"suffix"=>"%",
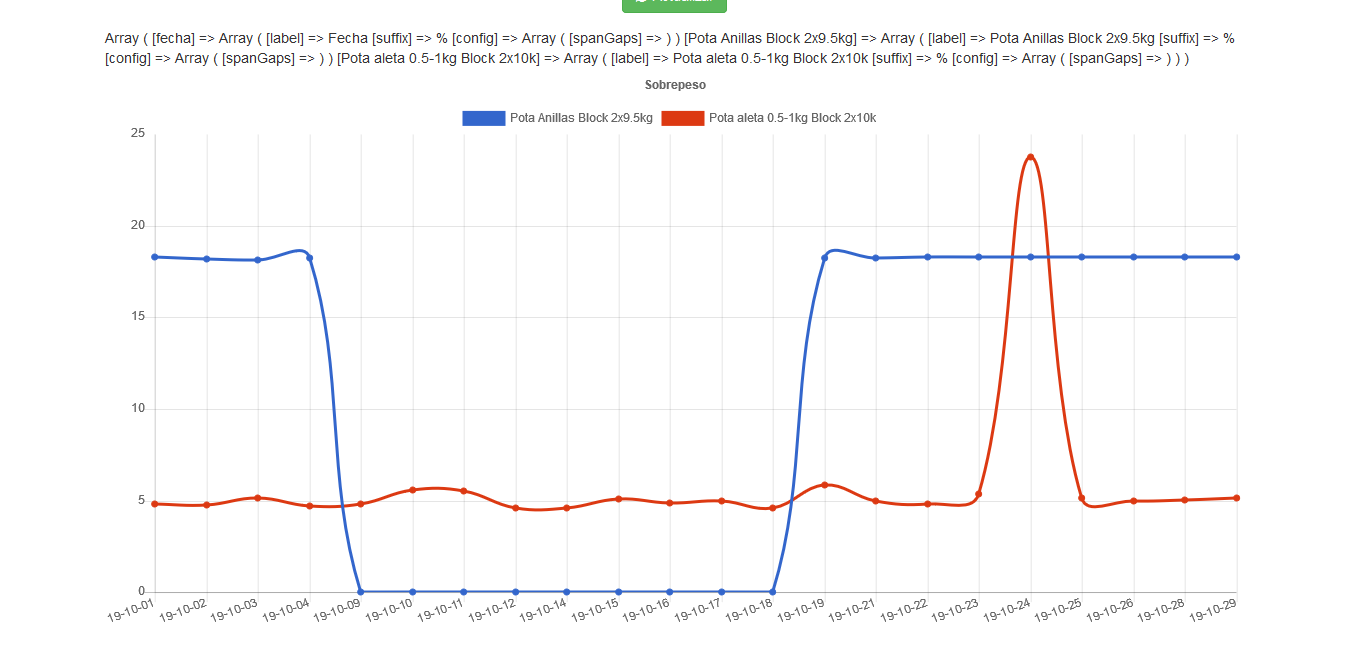
"config"=>array("spanGaps"=>false),
);
}
$dataStore = $this->dataStore('overweight');
LineChart::create(array(
"title"=>"Sobrepeso",
"dataSource"=>$dataStore,
"columns"=>$columns,
));
Please try again with this code:
foreach($columnNames as $name)
{
    if($name=="fetcha")
        $columns[$name] = array("label"=>ucfirst($name));
    else
        $columns[$name] = array(
            "label"=>ucfirst($name),
            "suffix"=>"%",
            "config"=>array("spanGaps"=>false),
        );
}
Let me know the result
Hi Koolreport,
Thanks you very much for your reply
I had assumed that the conditional was "==" and not "!="
The problem is in spamGaps config because if I use other like steppedLine or showLine it is working
Regards
foreach($columnNames as $name)
{
    if($name=="fetcha") //conditional
        $columns[$name] = array("label"=>ucfirst($name));
    else
        $columns[$name] = array(
            "label"=>ucfirst($name),
            "suffix"=>"%",
            "config"=>array("spanGaps"=>false),
        );
}
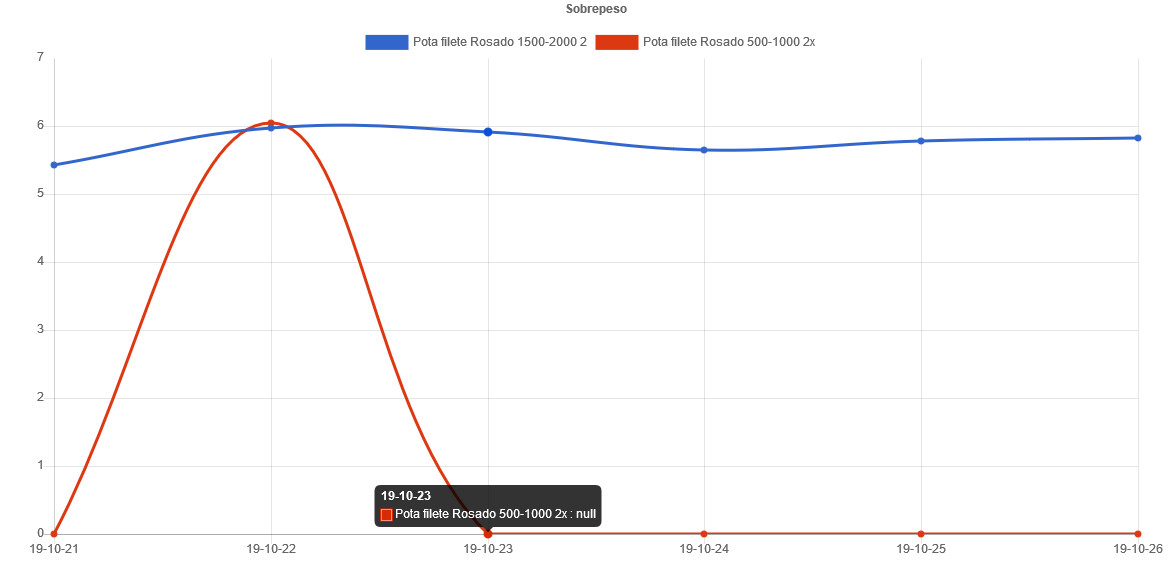
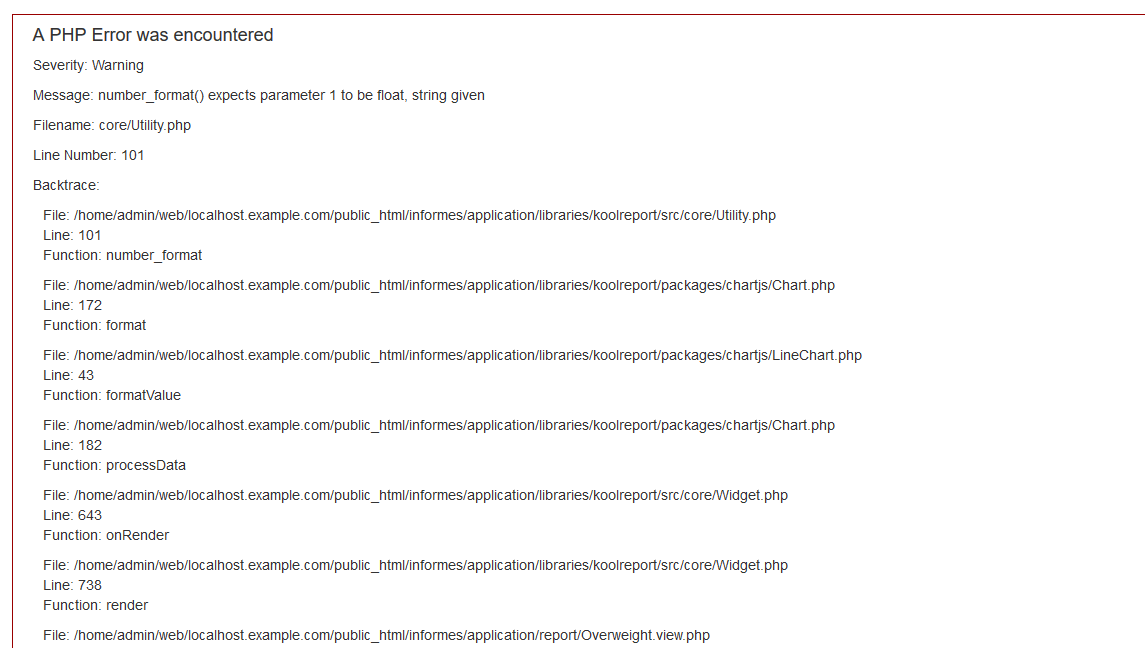
Hi Koolreport,
I have tried this: force 0 to null with formatValue:
$columnNames = array_keys($this->dataStore("overweight")->meta()["columns"]);
$columns = array();
foreach($columnNames as $name)
{
    if($name=="fecha")
        $columns[$name] = array("label"=>ucfirst($name));
    else
        $columns[$name] = array(
            "label"=>ucfirst($name),
            "formatValue"=>function($value){if($value==0){return NULL;}else{return number_format($value,2)."%";}},//NULL if value==0
            "config"=>array("spanGaps"=>false),
        );
}
And this is the result:
You do this in the setup() method:
...
->pipe(new RemoveColumn(array(
"{{all}}"
)))
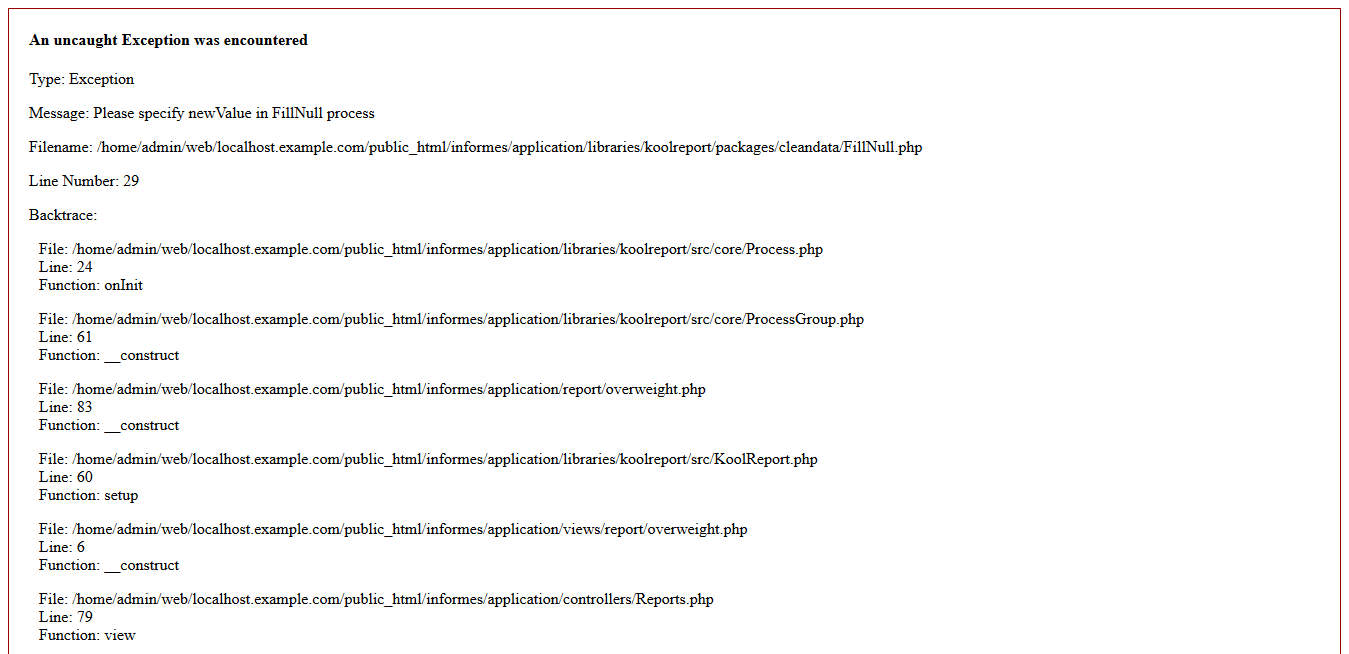
->pipe(new \koolreport\cleandata\FillNull(array(
"targetValue"=>0,
"newValue"=>null,
)))
->pipe($this->dataStore('overweight'));
Basically the FillNull will target all 0 value and replace with NULL value.
Please try and let us know.
Nevermind, you do like following
...
->pipe(new RemoveColumn(array(
      "{{all}}"
    )))
->pipe(new \koolreport\processes\Custom(function($row){
    foreach($row as $k=>$v)
        if($v===0) $row[$k]=null;
    return $row;
}))
->pipe($this->dataStore('overweight'));
Let me know if it works.
Build Your Excellent Data Report
Let KoolReport help you to make great reports. It's free & open-source released under MIT license.
Download KoolReport View demo