Of course. This is the browser code:
<?php
use \koolreport\widgets\koolphp\Table;
use \koolreport\widgets\google\BarChart;
use \koolreport\widgets\google\PieChart;
use \koolreport\widgets\google\ColumnChart;
?>
<?php
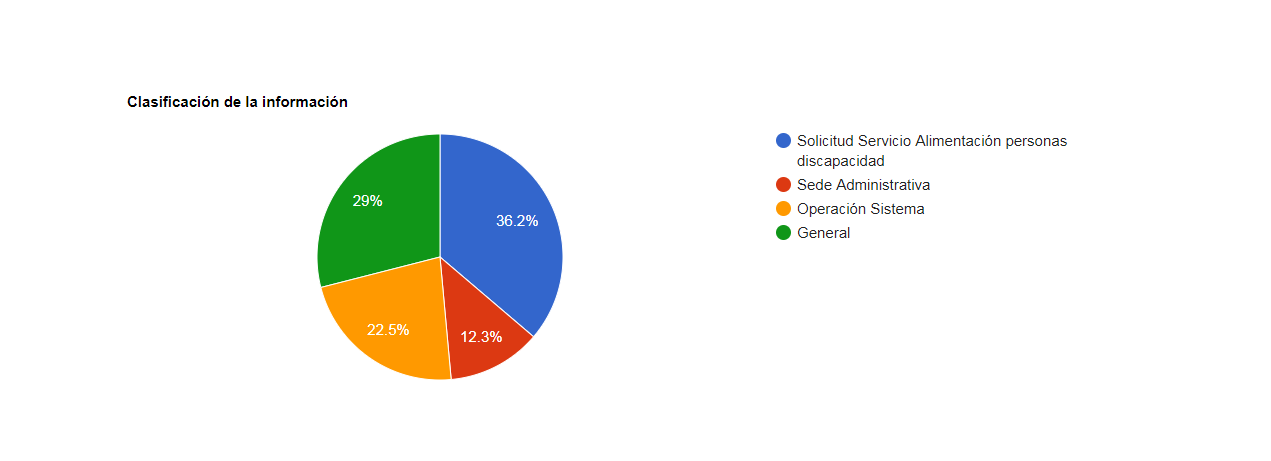
PieChart::create(array(
    "title"=>"Clasificación de la información",
    "dataSource"=>$this->dataStore('clasificacion_informacion'),
    "columns"=>array(
        "atencion"=>array(
            "label"=>"Tipo de Atención para Información"
        ),
        "cantidad"=>array(
            "type"=>"number",
            "label"=>"Cantidad"
        )
    )
));
?>
And this is the excel code:
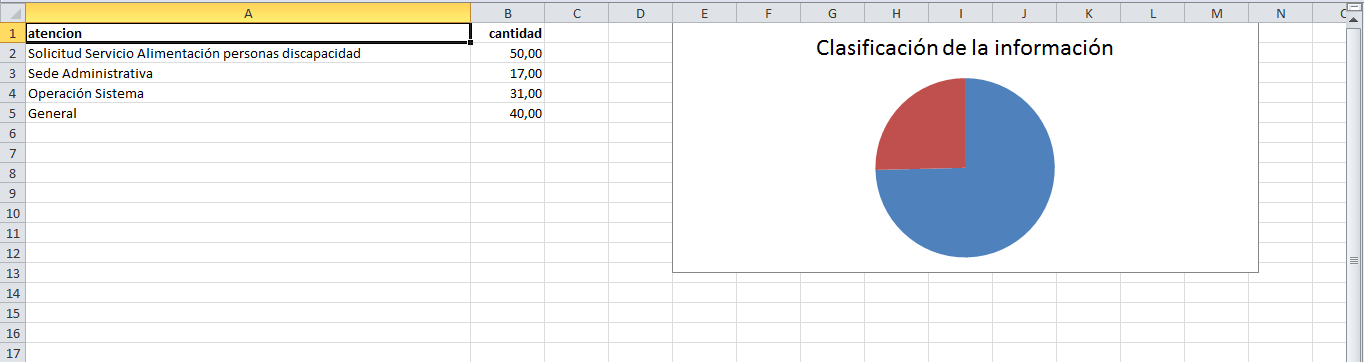
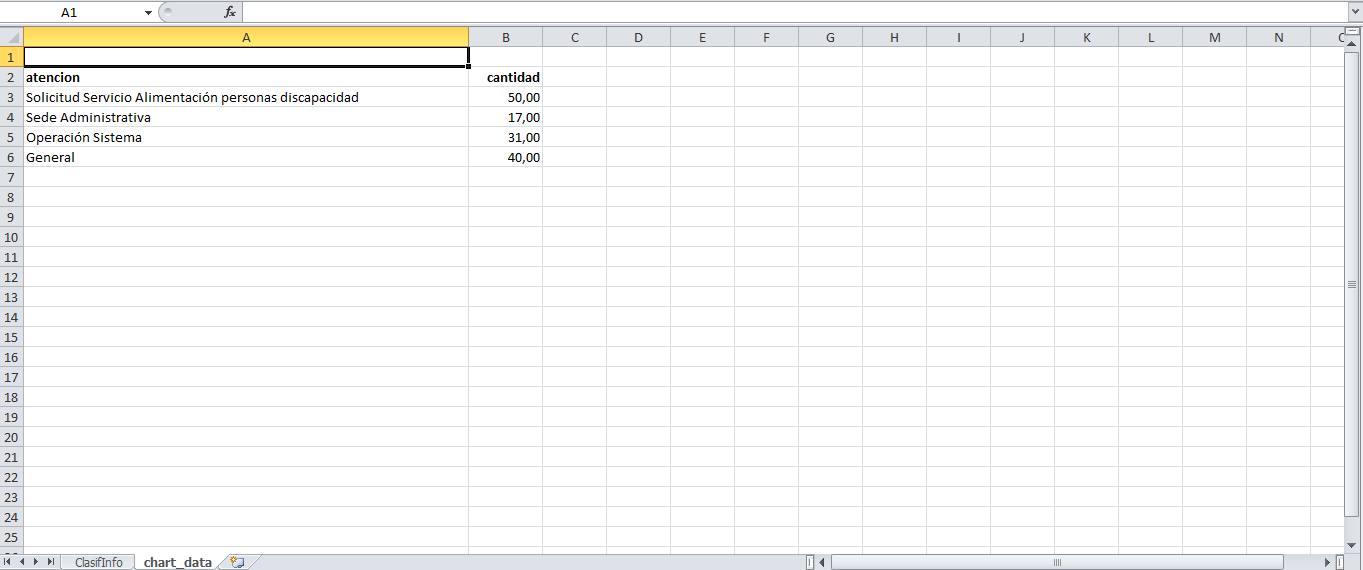
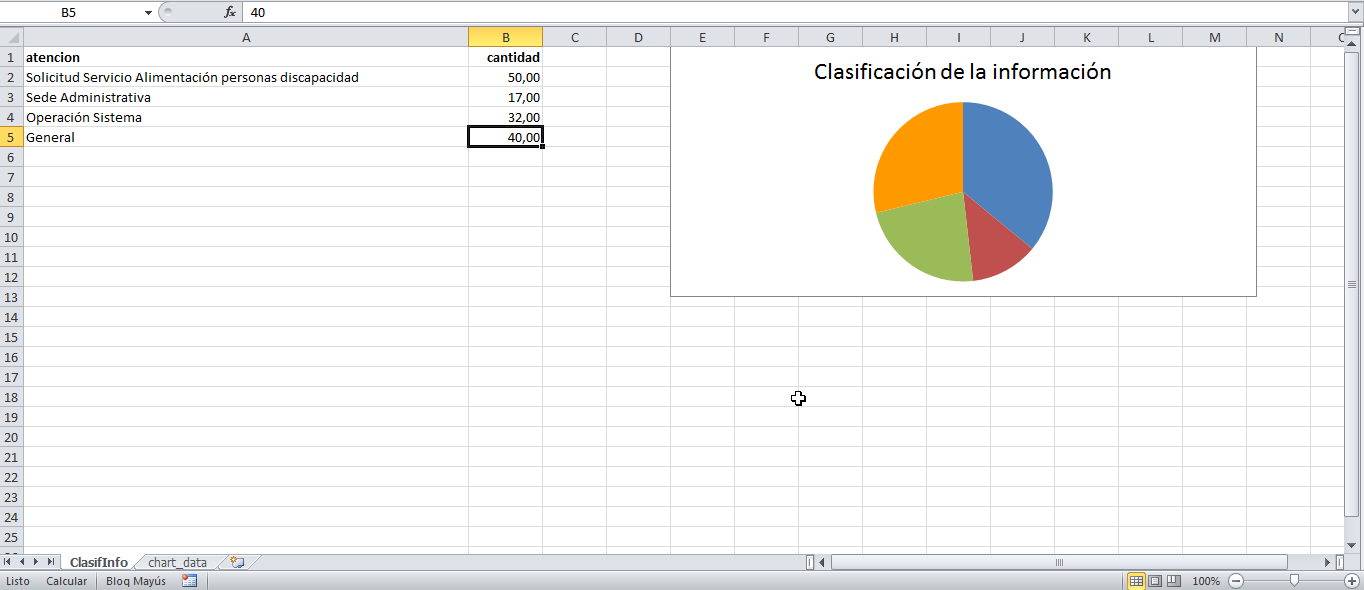
<?php
use \koolreport\excel\Table;
use \koolreport\excel\BarChart;
use \koolreport\excel\PieChart;
use \koolreport\excel\LineChart;

$sheet1 = "Clasificacion Informacion";
?>
<div sheet-name="ClasifInfo">
<div>
    <?php
        Table::create(array(
            "name"=>'clasificacionInformacion',
            "dataSource"=>'clasificacion_informacion'
        ));
    ?>
</div>
<div range="E1:N13">
    <?php
        PieChart::create(array(
            //'excelDataSource'=>'clasificacionInformacion'
            'title'=>"Clasificaci贸n de la informaci贸n",
            'dataSource'=>'clasificacion_informacion',
            /*"columns"=>array(
                "atencion"=>array(
                    "label"=>"Tipo de Atenci贸n para Informaci贸n"
                ),
                "cantidad"=>array(
                    "type"=>"number",
                    "label"=>"Cantidad"
                )
            )*/
        ));
    ?>
</div>
</div>
Thanks a lot.