KoolReport's Forum

Official Support Area, Q&As, Discussions, Suggestions and Bug reports.
Forum's Guidelines

Creating a population pyramid, how to format for positive values only on haxis #1003

Open Toby Beresford opened this topic on on Jul 20, 2019 - 3 comments

Toby Beresford commented on Jul 20, 2019

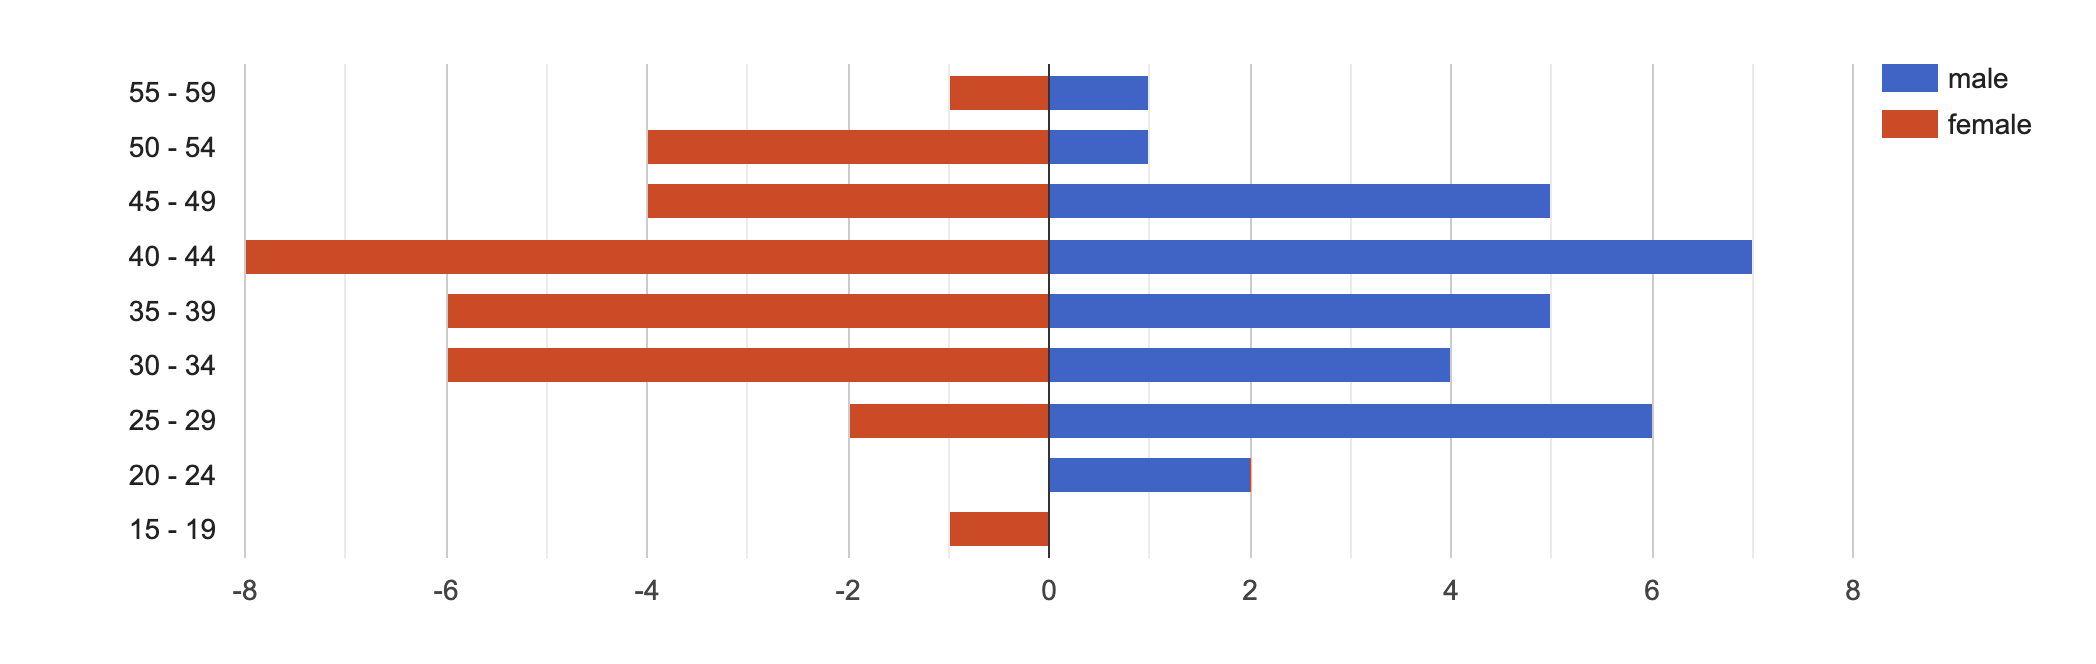
I am trying to copy this jsFiddle which shows a population pyramid:

However in Koolreport the only piece I can't seem to get working is the hAxis to format the negative values for female

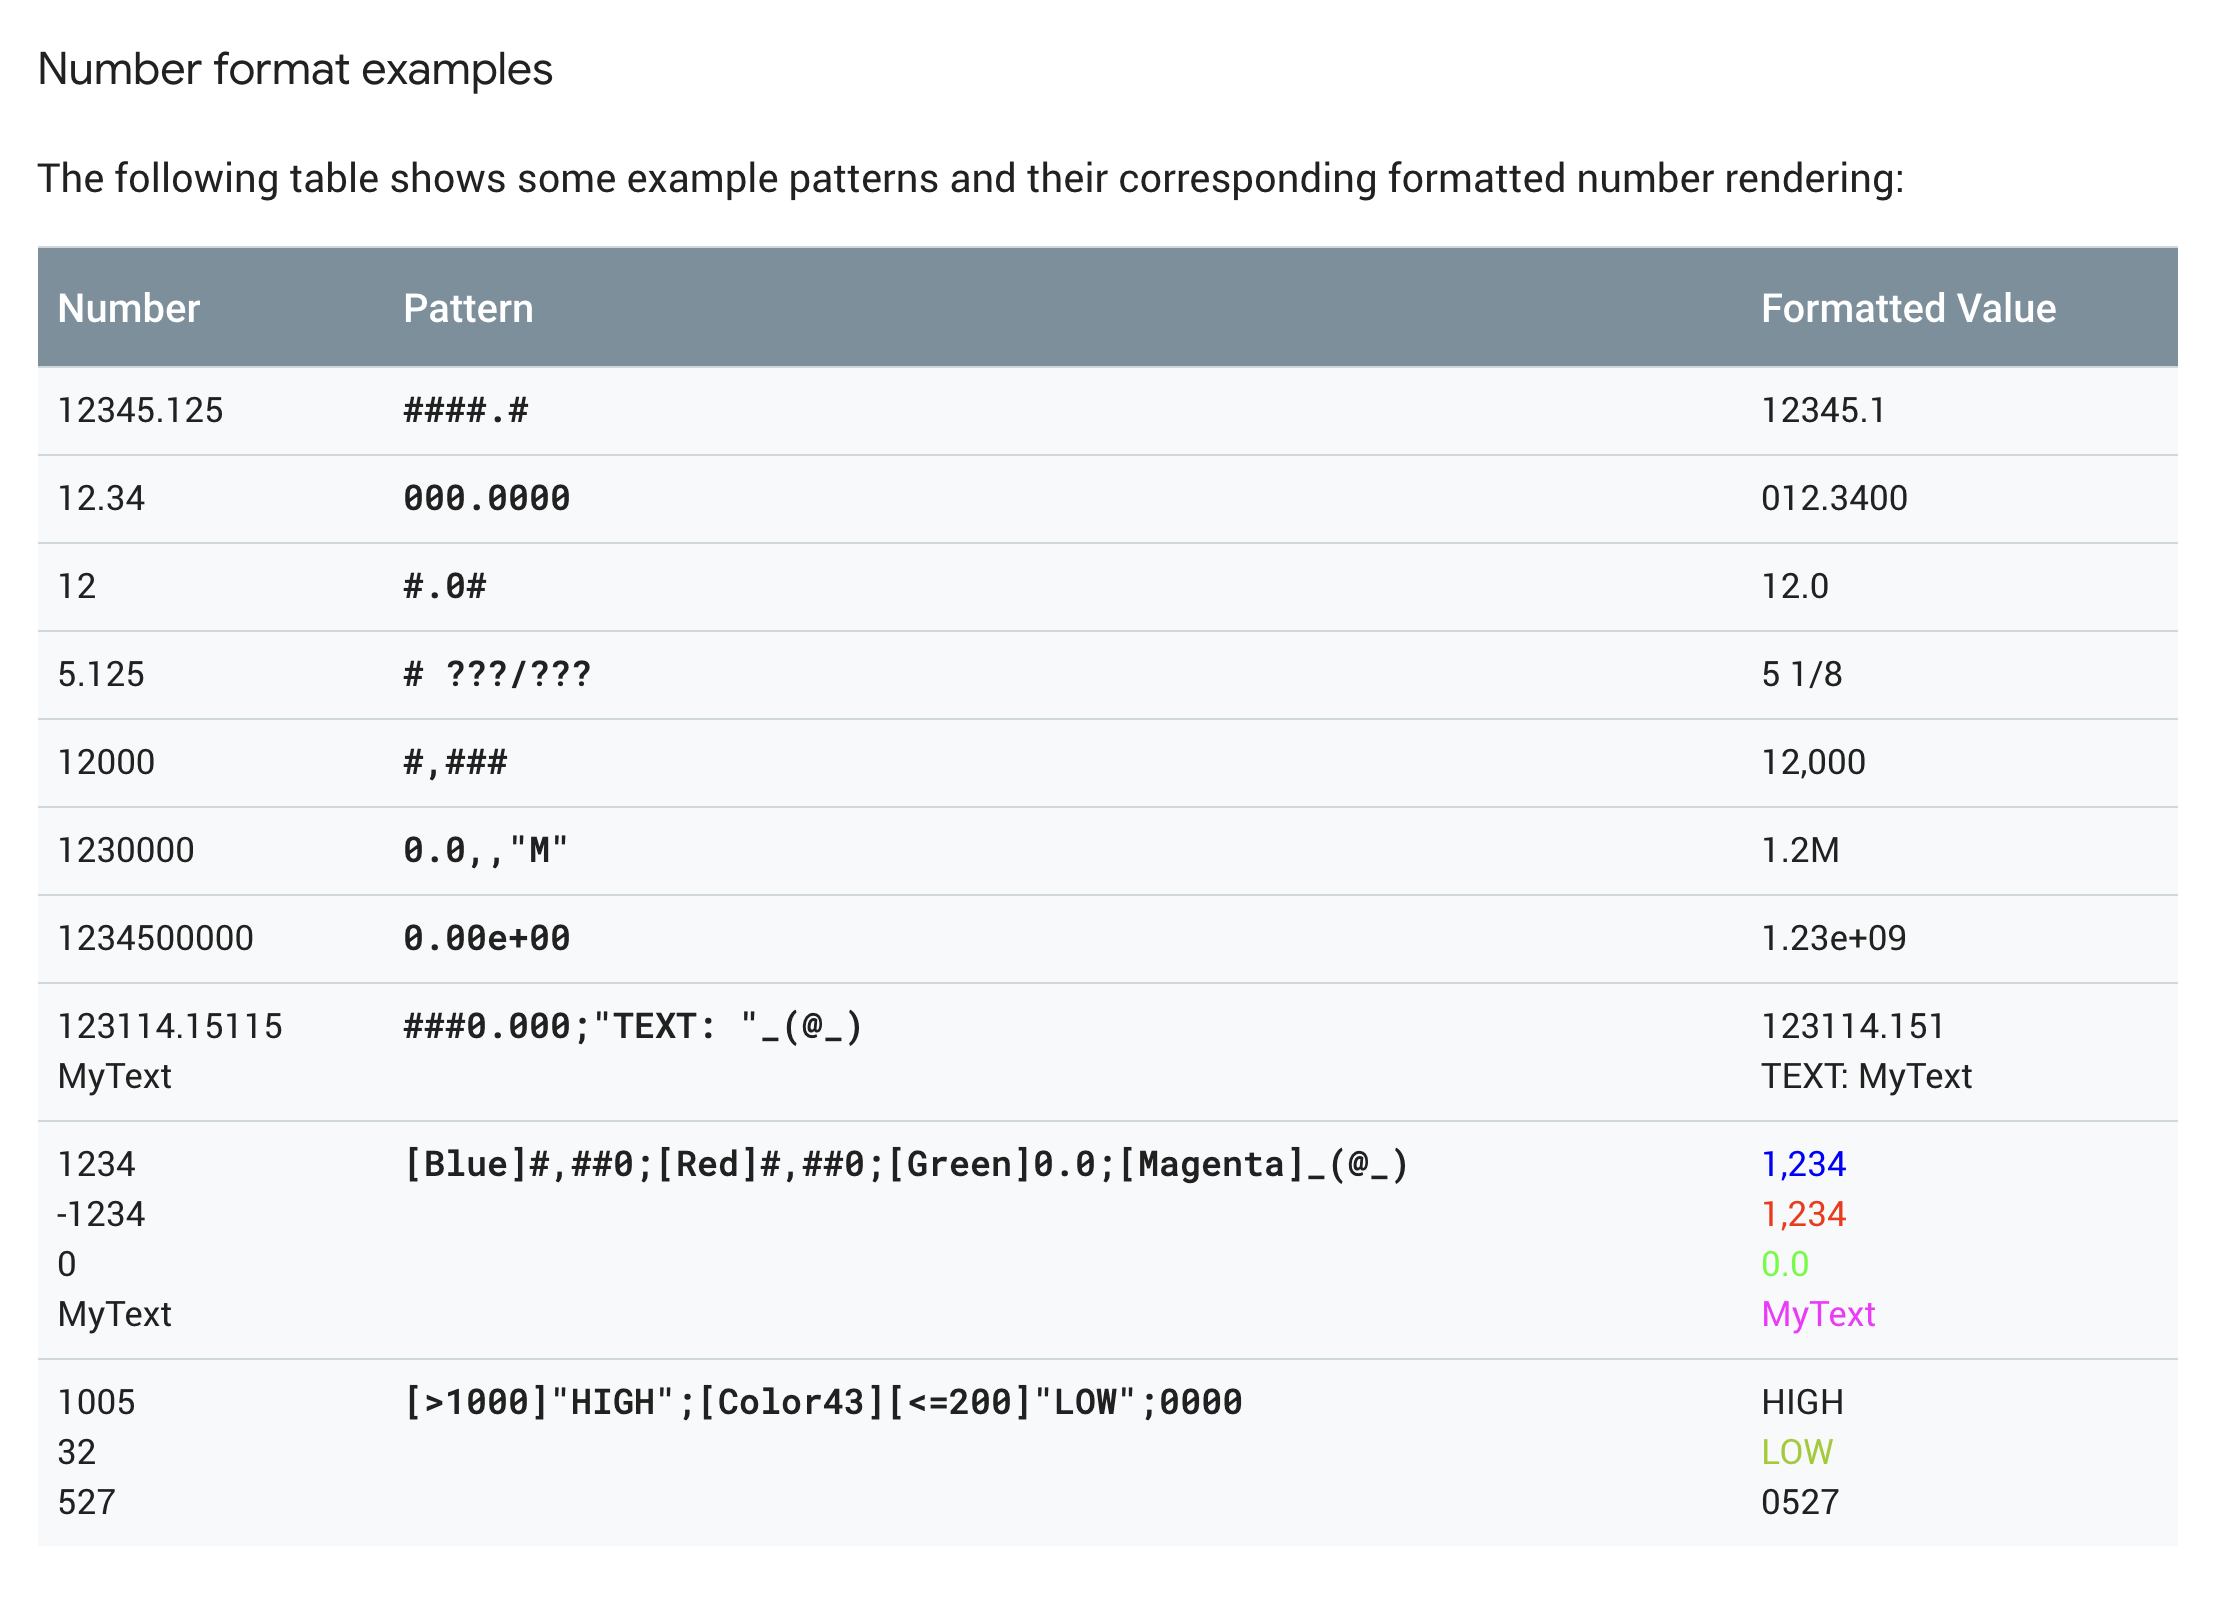
I should be able to use ; or format [positive];[negative] as per the format rules here:

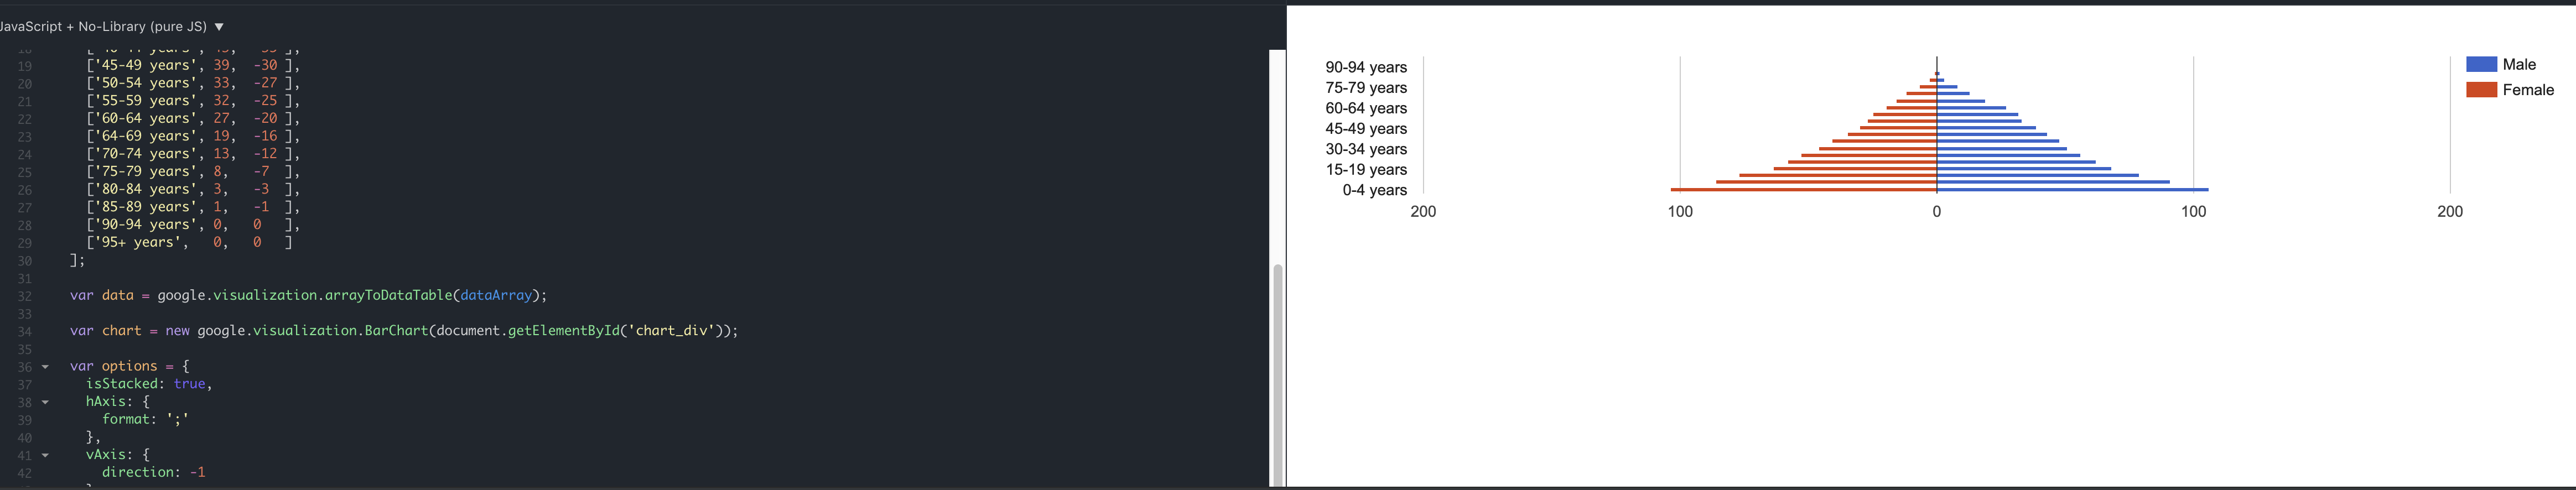
However my KoolReport is rendering as follows:

The female xAxis labels are still appearing as negative. I want them to also show positive. If I mouse over the bars then the formatValue kicks in and shows the female ones as positive numbers. It's just the xAxis that is not behaving as I want it to.

This is my code:

                    <?php
                    BarChart::create([
                        "dataStore" => $report->dataStore("pyramid"),
                        "columns" => [
                            "age_range" => [
                                "label" => "Age Range",
                            ],
                            "male" => [
                                "type" => "number",
                                "formatValue" =>function($value) {
                                    return number_format($value, 0);
                                }
                            ],
                            "female" => [
                                "type" => "number",
                                "formatValue" =>function($value) {
                                    return number_format(0-$value, 0);
                                }
                            ],
                        ],
                        "width" => "100%",
                        "options" => [
                            "isStacked" => true,
                            "hAxis" => ['format' => ';'],
                            "vAxis" => ['direction' => -1],
                        ],
                    ]);
                    ?>

Any suggestions?

KoolReport commented on Jul 21, 2019

The most important settings to avoid the negative axis number is the

"hAxis" => ['format' => ';'],

Your code looks good to me actually. May be I will ask dev.team to make a small test.

KoolReport commented on Jul 21, 2019

Could you please view the page source and paste for me the initiation code of the BarChart.

Toby Beresford commented on Jul 21, 2019

Sure, here we go. Thanks for your help

<script type='text/javascript' src='/koolreport_assets/2474476949/KoolReport.js'></script><krwidget widget-name='gchart5d3464c0374714' widget-type='koolreport/widgets/google/BarChart'><div id="gchart5d3464c0374714" style="width:100%;height:400px;"></div>
<script type="text/javascript">
    KoolReport.widget.init({"js":["\/koolreport_assets\/348365833\/jquery.min.js",["\/koolreport_assets\/3574888999\/googlechart.js"]],"css":[]},function(){
        gchart5d3464c0374714 = new KoolReport.google.chart("BarChart","gchart5d3464c0374714",["age_range","male","female"],[["Age Range","male","female"],["15 - 19",{"v":0,"f":"0"},{"v":-1,"f":"1"}],["20 - 24",{"v":2,"f":"2"},{"v":0,"f":"0"}],["25 - 29",{"v":6,"f":"6"},{"v":-2,"f":"2"}],["30 - 34",{"v":4,"f":"4"},{"v":-6,"f":"6"}],["35 - 39",{"v":5,"f":"5"},{"v":-6,"f":"6"}],["40 - 44",{"v":7,"f":"7"},{"v":-8,"f":"8"}],["45 - 49",{"v":5,"f":"5"},{"v":-4,"f":"4"}],["50 - 54",{"v":1,"f":"1"},{"v":-4,"f":"4"}],["55 - 59",{"v":1,"f":"1"},{"v":-1,"f":"1"}]],{"isStacked":true,"hAxis":{"format":";"},"vAxis":{"direction":-1}},{"package":"corechart","stability":"current","mapsApiKey":""});
                            });
</script></krwidget>                        

Build Your Excellent Data Report

Let KoolReport help you to make great reports. It's free & open-source released under MIT license.

Download KoolReport View demo
help needed

None