January 16, 2018
Drill down and drill through are two extremely powerful features in business intelligence. They both give the user the ability to see data and information in more detail–although they do so in different fashions.
Drill Down
Drill down is a capability that takes the user from a more general view of the data to a more specific one at the click of a mouse. For example, a report that shows sales revenue by state can allow the user to select a state, click on it and see sales revenue by county or city within that state. It is called “drill down” because it is a feature that allows the user to go deeper into more specific layers of the data or information being analyzed.
Further levels of drill down can be set up within the report–practically as many as supported by the data. In our example, the drill-down can go from country to state to city to zip code to specific location of stores or individual sales reps. Typically, the look and feel of each level of the report is similar–what changes is the granularity of the data.
- Example 1: Sale By Time
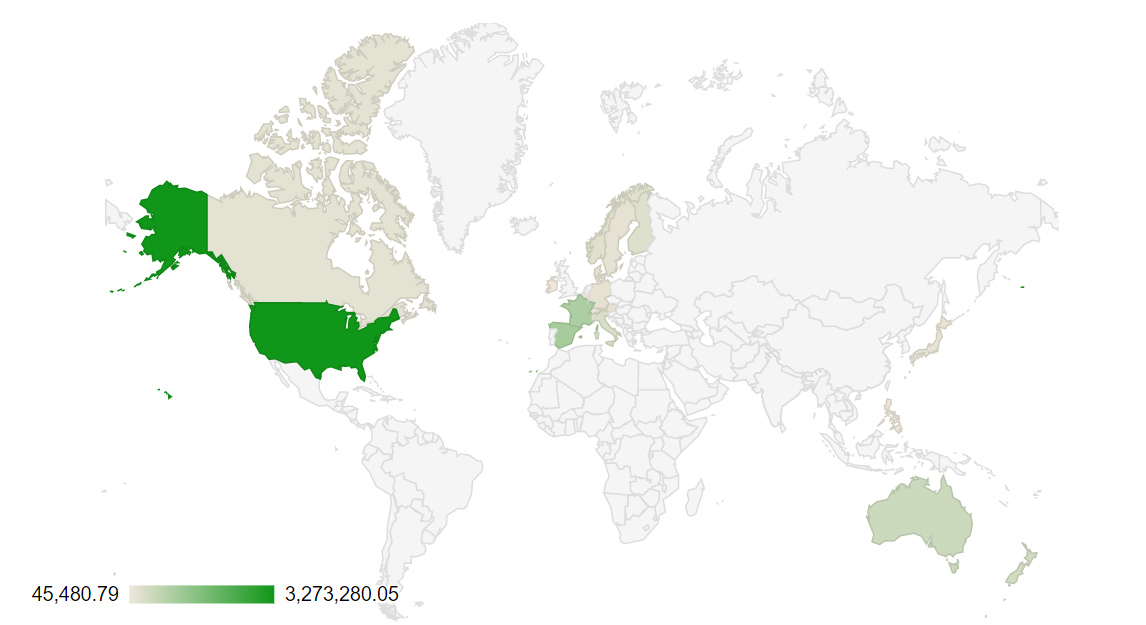
- Example 2: Sale By Location
Drill Through (MultiView)
Instead of taking the user to a more granular level of the data, drill through takes him to a report that is relevant to the data being analyzed, also at the click of a mouse. For example, a tabular report that shows sales revenue by state can allow the user to click on it and reveal an analysis grid of the same data, or a heat map representing the data in visual form. It is called “drill through” because it is a feature that allows the user to pass from one report to another while still analyzing the same set of data.
- Example: Sale By Month With Different Views
Benefits of Drill Down and Drill Through
Gain instant knowledge of different depths of the data – Drill down gives the user a deeper insight of the data by letting him see what makes up the figures he’s analyzing. For example, in mere seconds, drill-down answers questions such as: of my National sales figure, which states are performing better? Which states are underperforming? And within each state, which territories are driving revenue?
See data from different points of view – Drill through allows users to analyze the same data through different reports, analyze it with different features and even display it through different visualization methods. This greatly enhances the users’ understanding of the data and of the reasons behind the figures.
Keep reporting load light and enhance reporting performance – By only presenting one layer of data at a time, features like drill down lighten the load on the server at query time and greatly enhance reporting performance–while offering great value to the end-user.
<3 koolreport team
December 27, 2017
GREAT NEWS! We are happy to let you know that we have released new version for Export and Inputs package. Also, a new package called DataGrid has joined KoolReport's package family.

Export 3.0.0
In the version 3.0.0 of Export package, we have added new property to settings called resourceWaiting. This property allows us to customize the time which Export package will wait for new coming resources. After the waiting time, Export package will start exporting content to PDF or other formats.
Previously the default waiting time is 1000ms however we found that the good amount of waiting time change server from server and case by case. For fast server and connection, you may set short waiting time to reduce the time to export. However for those slow server or bad connection, the longer waiting time should be considered otherwise page resources may not be loaded fully.
Check documentation
Inputs 3.0.0
The biggest change in new version of Inputs is the client event handling features. All input controls in Inputs package are equipped with clientEvents property to set action. The common usage is like below example:
TextBox::create(array(
    ...
    "clientEvents"=>array(
        "focus"=>"function(){
            console.log('focus');
        }",
        "blur"=>"function(){
            console.log('blur');
        }"
    )
));
The event name is followed by a JavaScript function in string type.
The event handling allows us to catch what happens then take needed actions. To better understand of client-events, please view example
DataGrid
DataGrid is our new package to facilitate the data's display table format. The package now contains a widget called DataTables. Beside displaying data, DataTables support advanced functionalities such as: table searching, column sorting, column reordering, paging and more.
DataGrid package is available in standalone package or in KoolReport Pro bundle.
Merry Christmas and Happy New Year
In this special occasion, we wish you have a full year of happiness and development. If you have not known, we are offering 30% OFF for KoolReport Pro. The promotion will ended soon so please hurry up to secure the offer.
<3 koolreport team
November 14, 2017
We have constructed a series of concise tutorials to help you get start faster with KoolReport. The tutorials will cover topics from the basic to the advanced. Enroll now!

Getting started with new things is always hard. That's why we always think about what we can do to help you master KoolReport in the easiest way. We improve our documentation, we add new examples, we write forum wiki etc. all of the efforts are just to make you get started faster and produce awesome reports.
Creating tutorials is our another effort for that purpose. We will guide you step-by-step through concept and practice. Some of the topics covered in the series are:
- Structure Of A Report
- Basic Of Data Processing
- Data Flow In KoolReport
- Time Series Aggregation
- Visualize Data With Google Charts
- Visualize Data With Koolphp Table
- Introduce Instant Package
- .. and many advanced topics waiting for you!
It's All Free! Enjoy!
<3 koolreport team
October 30, 2017
GREAT NEWS! We have released KoolReport 1.72.8 with some important enhancements: Table Pagination, DataStore Aggregation, new Filter's Operators and more.

Table Pagination
We have added the pagination feature to koolphp\Table. To enable this feature, we only need to add "paging" settings to the Table:
Table::create(array(
    "paging"=>array(
        "pageSize"=>10,
    )
))
You may view example here.
DataStore Aggregation
We have added 4 new methods to DataStore: min(), max(), avg() and sum(). So in the case you want to get total of an specific column you may do:
$totalSaleAmount = $this->dataStore("sales")->sum("amount");
Filter's Operators
The Filter process now has "in" and "notIn" operators. The "in" works like the IN operators in SQL which accept only rows with column value within an array:
->pipe(new Filter(array(
    array("firstName","in",array("Peter","Karl","David")),
)))
Bug fixes
We have fixed small bug in get() method of DataStore. In the previous version, the method returned wrong row. Issue has been fixed now.
KoolReport Pro
KoolReport Pro 1.5.0 has been released with latest core and extended packages. The packages updated in this version are Export 2.5.0, Inputs 2.7.0 and Pivot 2.2.0.
Reminder: Today is the last day of our promotion 30% OFF for KoolReport Pro. If you are interested in KoolReport Pro licenses, please purchase now before getting too late. Don't miss it!
<3 koolreport team
September 22, 2017
BIG PARTY AGAIN!! We've released KoolReport version 1.61.2. We must say this is the biggest update ever. Please do not let the below picture distract you from going to our website and grasping the new version. This release really contains a lot of enhancements and deserved to be the best version.

KoolReport
KoolReport is now able to render sub view, it means that in our report view we can render another view inside. This is important feature because it helps to divide a big and complex report into smaller and less complicated ones which you can handle easily.
We also update the event handler and add a new event called OnResourceInit which happens when the resource is started and ready to receive registration. This is useful if you have intention to write extension for KoolReport. You may use this event to register resources such as js or css.
DataStore
DataStore is equipped with number of new functions to access data. Now you can filter/sort data before sending them to widgets.
Table::create(array(
    "dataStore"=>$this->dataStore("customers")->filter("age", ">", 35)->sort(array("name" => "desc")),
    ...
));
Also, you can easily get the top rows or bottom rows by those four new functions top(),bottom(), topByPercent() and bottomByPercent().
Widget
Widget now has a new static function called html(). This function instead of rendering widget, will return the widget in form of html. It opens opportunity to render a widget inside another one. For example, it is possible now to list all products with BarCode inside Table.
The most used widget, Table, now is able to set data directly without using dataStore. You can do:
Table::create(array(
    "data"=>array(
        array("name"=>"Peter","age"=>30),
        array("name"=>"Karl","age"=>29),
    ),
    ...
))
The footer is able to show count rows. Thanks Peter Gregory for his good suggestion.
Like Table widget, Google Chart widgets are able to set data as well. There is no need for dataStore property any more. By this way, you can create charts and graphs on the fly without preparing data through setup().
Bug fixes
- The
ProcessGroup has a serious bug preventing it from receiving the starting input signal has been solved.
- The problem of not detecting the end of input has been solved for all processes.
- The problem of
Group process can not receive data from multiple sources is solved as well.
Summary
Above is the summary of enhancements and bug fixes for KoolReport in this version. In this short note, we are only able to highlight some of the key changes, there are many more small improvements that we do not list. Please take some time to go to our website and download new version. To upgrade, you just need to overwrite the whole old koolreport folder with the new one. Simple as that.
Download New Version Now
Note: The KoolReport Pro is also updated with new core and all latest packages. Some new packages added are BarCode (generate barcode and qrcode), Cache (speed up your report), Statistics (calculate data statistics) and CleanData (solve missing data).
<3 koolreport team