October 18, 2023
In the ever-evolving world of data-driven decision-making, data visualization plays a pivotal role. It transforms raw data into meaningful insights and empowers businesses and developers to make informed choices. Today, we're thrilled to introduce the seamless integration of ApexCharts with KoolReport, opening up a world of possibilities for developers and businesses seeking advanced data visualization solutions.

The fusion of KoolReport, a robust PHP framework specializing in data reporting, and ApexCharts, a powerful JavaScript charting library, marks a significant leap forward in the realm of data visualization.
A Dynamic Duo: KoolReport and ApexCharts
KoolReport has long been a trusted ally for developers in the realm of data reporting. Its ease of use, flexibility, and extensive feature set have made it a go-to solution for generating insightful reports and dashboards directly from data sources like databases. Now, with the integration of ApexCharts, KoolReport takes data visualization to the next level.
ApexCharts, as a versatile JavaScript charting library, offers an impressive range of chart types, interactivity options, and customization features. Whether you need to create compelling line charts, interactive bar graphs, insightful pie charts, or any other data visualization, ApexCharts delivers. The seamless integration of ApexCharts into KoolReport extends the framework's capabilities, allowing you to harness the full potential of both tools in tandem.
Why This Integration Matters
- Enhanced Data Presentation: With ApexCharts at your disposal, you can transform your data into stunning, interactive visualizations that are both aesthetically pleasing and informative. It's the key to presenting data in a way that resonates with your audience.
- Simplified Development: Developers often face the challenge of creating complex data visualizations from scratch. With the integration of ApexCharts into KoolReport, this process is simplified, allowing for faster development and reduced coding effort.
- Customization: ApexCharts is renowned for its flexibility. You can customize your charts to fit the unique requirements of your project. Whether it's adjusting colors, styles, or interactivity features, the power is in your hands.
- Interactivity: Interactive charts engage users, enabling them to explore and gain deeper insights into the data. ApexCharts facilitates the addition of features like tooltips, zooming, and data filtering, making your charts come to life.
- Consistency and Uniformity: The integration ensures a seamless experience within KoolReport. The charts blend effortlessly with your reporting framework, maintaining a consistent and professional look throughout your reports and dashboards.
Getting Started with ApexCharts in KoolReport
Getting started with ApexCharts in KoolReport is a breeze. The integration is designed to be developer-friendly and intuitive. You can easily create and configure your charts directly from your PHP code. No need to delve into complex JavaScript coding or deal with time-consuming client-side processes. Here's a glimpse of how straightforward it can be:
<?php
\koolreport\apexcharts\DonutChart::create(array(
        "dataSource" => [
           ['value'],
           [44],
           [55],
           [41],
           [17],
           [15]
        ],
        "columns" => [
            "value"
        ],
        "options" => [],
        "showLabel" => true,
        "maxWidth" => "450px",
    ));
?>
This simple code snippet demonstrates how you can create a donut/pie chart using ApexCharts within KoolReport. You can customize chart types, data, and various options to tailor your visualizations precisely to your needs.
View this example on KoolReport demo
Elevate Your Data Visualization
The integration of ApexCharts with KoolReport opens up a world of opportunities for developers, businesses, and data enthusiasts. Whether you're looking to create impactful reports, dynamic dashboards, or engaging presentations, this powerful combination empowers you to take your data visualization to new heights.
With the fusion of KoolReport's data reporting prowess and ApexCharts' rich charting capabilities, you can effortlessly transform your data into insights that drive informed decisions. So, embrace the future of data visualization with ApexCharts and KoolReport and experience the magic of turning data into knowledge.
Elevate your data visualization game, explore the endless possibilities, and unlock the true potential of your data.
July 4, 2023
As a budding developer, you may find yourself grappling with the intricacies of visualizing data from databases like MySQL in captivating charts and graphs. Fear not, for I am here to guide you through the process with the help of KoolReport—a powerful PHP framework that will revolutionize your data visualization journey and simplify your development workflow.
Traditionally, achieving data visualization involved a series of complex steps. You would need to harness the power of PHP to query your database, transform the retrieved data into the specific format required by the chosen charting library, export it as JSON, and then write client-side JavaScript code to render the charts. This process not only consumed a significant amount of time but also presented challenges when switching between different charting libraries.
References:
- AnyChart: Connecting MySQL Database to JS Chart Using PHP
- FusionChart: Create Interactive Charts using PHP and MySQL Database
- Learning Programming: Google Chart with PHP and MySQL
But behold! KoolReport is about to unveil a new world of data visualization simplicity. Developed with a laser focus on data reporting, this framework will enable you to effortlessly create visually stunning charts directly from your database, eliminating the need for tedious and error-prone transformation processes. Allow me to guide you through an example that showcases the elegance and power of KoolReport.
Imagine you wish to create a column chart to visualize the spending amount of each customer in your MySQL database. With KoolReport, accomplishing this becomes a breeze. Let's dive into the code:
<?php
use \koolreport\datasources\PdoDataSource;
use \koolreport\widgets\google\ColumnChart;

// Database connection information
$connection = array(
    "connectionString" => "mysql:host=localhost;dbname=sales",
    "username" => "root",
    "password" => "",
    "charset" => "utf8"
);

// Create a column chart to visualize the spending amount of each customer.
ColumnChart::create([
    "dataSource" => (new PdoDataSource($connection))->query("
        SELECT customerName, SUM(amount) as total
        FROM orders
        GROUP BY customerName
    ")
]);
Impressive, isn't it? With just a few lines of code, you establish a connection to your MySQL database, retrieve the desired data, and generate a beautiful column chart displaying the spending amount for each customer. The simplicity and efficiency of KoolReport allow you to focus on the bigger picture rather than being tangled in cumbersome technicalities.
Moreover, KoolReport offers a diverse range of chart types to cater to your specific needs. From fundamental line charts and bar charts to intricate pie charts, area charts, geo charts, gauge charts, histograms, and combo charts, you have the freedom to unleash the full potential of your data.
What truly sets KoolReport apart is its seamless integration with multiple charting libraries. Whether you prefer Google Charts, ChartJS, Morris Chart, D3, or new player ApexCharts, KoolReport has you covered. Thanks to its common API, transitioning between charting libraries is effortless. By merely changing the chart class, you can explore different visualization options without wasting precious time rewriting your entire transformation process.
In summary, as an aspiring developer, you now possess a powerful tool—KoolReport—to simplify your data visualization endeavors. This framework empowers you to streamline your development process, save invaluable time, and focus on creating impactful data visualizations. Say goodbye to convoluted data transformations and embrace a world where charting becomes an intuitive and seamless experience. With KoolReport by your side, you can elevate your data visualization skills and unlock a realm of possibilities.
December 25, 2021
Reporting section is always a part of any system, sometimes it plays a crucial part. We have learnt this through hundreds of projects we did for our customers. So what is KoolReport and why you should consider having it in your great php application.
What is KoolReport?
By definition, KoolReport is an intuitive and flexible open-source PHP Reporting Framework for faster and easier data report delivery. Just like any php framework like Laravel or CodeIgniter, KoolReport provides developers a frame to code, a list of ready-made functionalities to build things. While other frameworks focus on constructing web applications, KoolReport only focuses on one thing: using PHP to construct great data reports.
Koolreport was born from the fact that data reports appear very often in almost all web applications. It is understandable because we always need to know the status of applications such as number of visitors, number of registered users or number of item sales and so on. We have built several hundred applications for our customers and 90% have report sections. In some of them, the report section is actually the main part. This is the biggest motivation for us to construct KoolReport in the first place.
There are 5 reasons that you would like to have KoolReport in your projects:
Easy
Easy to install and easy to use. You can install KoolReport by either downloading a copy and putting it inside your application or by using composer with a single command line. The structure of a report is very simple, one php class for report’s definition and one view file for report’s visualization. That’s why you can start using KoolReport in almost no-time.
Single purpose
KoolReport only does one thing and only one thing: building a good data report. Nothing more. You will not see routing, authentication or whatsoever. Is it bad? It depends on each opinion but for us, doing one thing best is better. “Make a good report” is not a simple task in fact. It includes 3 things.
First is the ability to connect to various sources and bring in data in one place. A report could be combined results from different data sources, a little from MySQL, some in Postgresql and other from CSV.
Second is the power of data processing. Data is gathered but how to fastly combine and transform them into meaningful information is the question. KoolReport contains over 30 built-in data processes which you can use with your data.
Last is data visualization capability. We have all meaningful data but without a good representation, the story could not be told. KoolReport is integrated with rich charts and graphs that come from well known libraries such as Google Chart, D3 or ChartJs for you to convey your data in the most impressive and interactive way.
Work with different environments
KoolReport can be integrated into Laravel or CodeIgniter or any MVC frameworks out and utilize their functionalities not existing in KoolReport. So KoolReport wants to be part of ecosystems, does one good thing and corporate with others, all heading to a final purpose: A great application.
Inherit experience of data report maker
Our deep experience of making data reports has been put into KoolReport. Moreover, the comments, recommendations and error report from users helps us to perfect KoolReport through many years. So using KoolReport, you are using a proven framework made by experts and growing from real use cases.
Free and open-source
Cost is always a part of the decision as always. KoolReport is released as a free and open-source library under MIT license which virtually gives you full right to use, to access and modify source-code as your own need.
So above are the top 5 reasons that you should use KoolReport inside your project. Of course, any solution has drawbacks and KoolReport will not be an exception. The reasons we give could be biased and the best way is your own experience with the framework.
March 14, 2020
It has been 25 years since the first version of PHP in 1995. Despite of its age, PHP is still one of the most programming languages in the world and be the top choice of many back-end developers. Let look at 10 PHP libraries that you need to know.

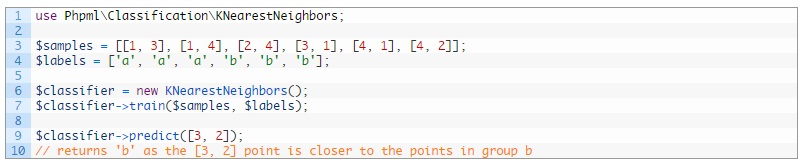
1. PHP-ML
https://github.com/php-ai/php-ml
A new way to approach Machine Learning (ML) in PHP, PHP-ML is an interesting library to work with. It provides you an easy way to use API training your bot to do prediction based on your inputs. It contains a series of algorithms to recognize patterns and performs complicated statistics.
2. Opauth
https://github.com/opauth/opauth
This library allows users to authenticate via their personal account on social networks or other services. Of course, it includes all the big names: Google, Facebook, Twitter, Github, Instagram, LinkedIn.
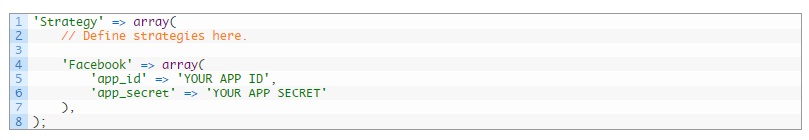
Opauth is supported by many PHP Frameworks, it is easily to be integrated in almost all current PHP applications such as: vanilla (plain) PHP applications, CakePHP, CodeIgniter, FuelPHP, Laravel, PrestaShop, and many more.
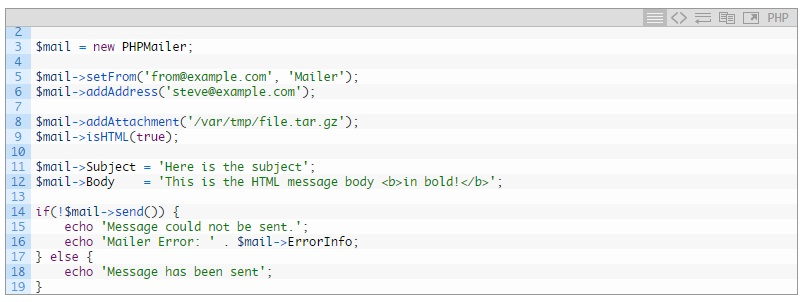
3. PHPMailer
https://github.com/PHPMailer/PHPMailer
No PHP library collections is perfect without PHPMailer - an complete email library for PHP. This project is supported by large community and being used in very popular applications such as Wordpress and Drupal. That makes it become first choice for sending email in PHP. It supports SMTP, HTML email and more..
4. ImageWorkshop
http://phpimageworkshop.com/
ImageWorkshop is open-source PHP library allowing you to work with image layers. With it, you can easily change image size, crop, create thumbnail, adding watermark and more. Here is some example:
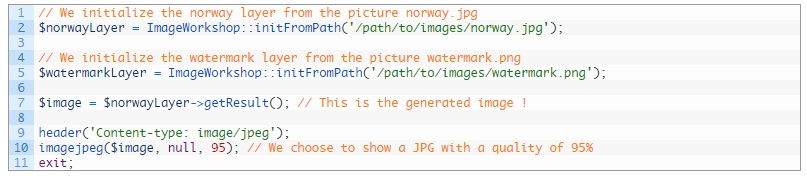
ImageWorkshop is developed to make your most common work on image in the easiest way. If you need more powerful library, you can look for Imagine library.
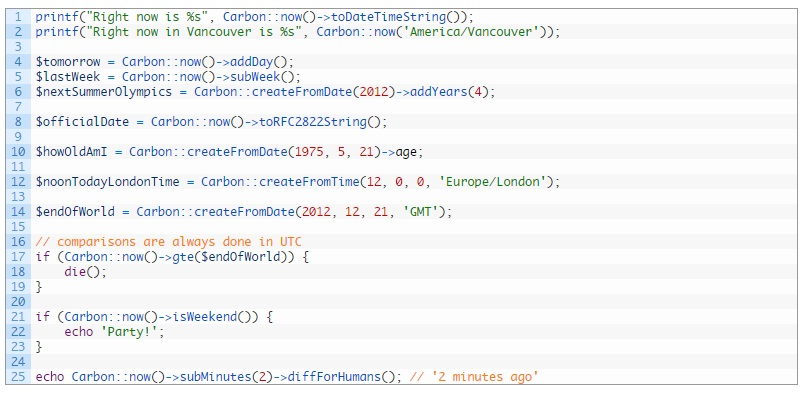
5. Carbon
https://github.com/briannesbitt/Carbon
Carbon is a great open source library to deal with datetime with various class and methods. For example:
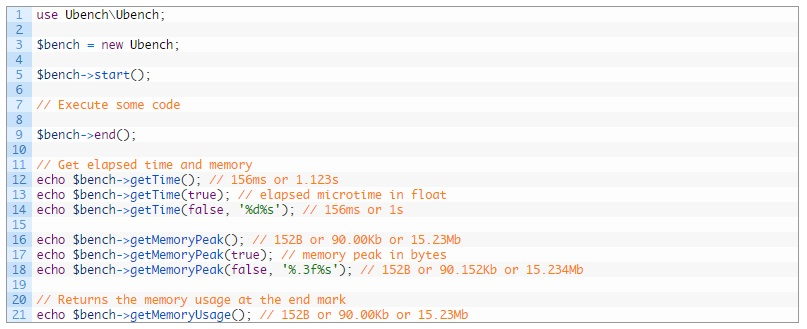
6. Ubench
https://github.com/devster/ubench
Ubench is a small library to check performance of your PHP code. It measures your code execution time as well as the needed memory. Using Ubench during your application development is a good idea as it can help to analyze, detect and enhance your code quality, ultimately improve the performance of your application.
7. Faker
Faker is a PHP library to create fake data. It is very convenient and easy to use when you need an experiment database or sample data for your web application. Let look at some sample code:
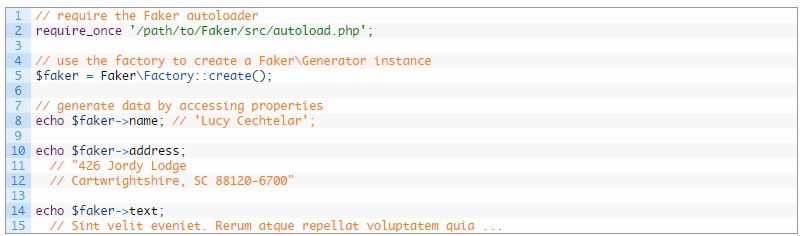
Every time you call properties of the object, a new random data will be generated.
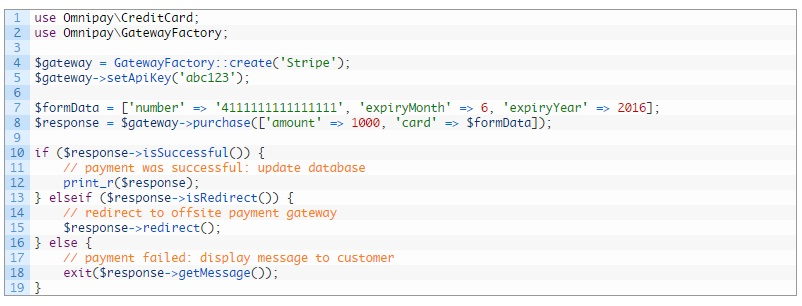
8. Omnipay
https://github.com/adrianmacneil/omnipay
Omnipay is a payment library for PHP. It has a clear and coherent API and support various payment gateway. With this library, we only need to work with one API and work with different payment options. Because of using single unified API, we can easily use many gateways at same time or switch between them when needed.
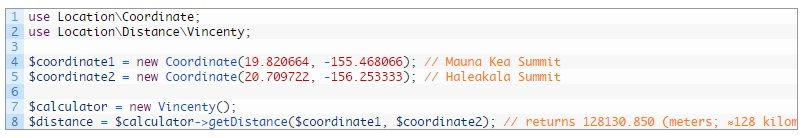
9. PHPGeo
https://github.com/mjaschen/phpgeo
PHPGeo is an simple library that allows us to calculate geographical distance between coordinates with high precision. This library support well those applications working based on geo locations. In order to get the coordinates, you can use location api of HTML5 or Yahoo api.
10. KoolReport's Google Chart
https://github.com/koolreport/core
KoolReport is an good open source PHP library to provide reporting capability for your application. Google Charts is part of KoolReport can bring you good and free php chart solution. It provides more than 20 most common & advanced charts. The code is very simple to use:
ColumnChart::create([
    "dataSource"=>[
        ["category","amount"],
        ["Computer",100],
        ["Laptop",50],
        ["Tablet",80],
        ["Phones",150],
    ]
]);
You may view more examples
Conclusion
Above are 10 most popular libraries that you can use to power your php application. Hope that our share is useful.
<3 koolreport team
February 7, 2020
We are happy to announce that we have released KoolReport core version 4.5.1 with new features. The KoolReport Pro also reaches same version number 4.5.1 with the new core update and the upgrade of individual packages such as Excel, Inputs, D3, ChartJs.
KoolReport's class
KoolReport's class is provided with new getXml() method to get the representation of your report in xml format. The xml contains both data and meta data of all report's datastores.
DataStore
In this version, we continue to enrich methods of datastore. DataStore has a new method called distinct(). As the name suggested, distinct method will have you to get a list of unrepeated values from a column. Furthermore, Datastore is provided with new toArray() and toJson() methods to get array and JSON. This could be useful if you need result in array form for further processing or JSON format to be returned in your REST API.
New DataSource
We have added new DataSource called ExistedPdoDataSource to handle source in case you only have the PDO object but connection settings. So you only need to send your existed PDO object as parameter to your report and provide it with ExistedPdoDataSource in settings() method.
JsonSpread process
JsonSpread is a new processed added to KoolReport in order to spread JSON data into column in data stream. By doing so, we are able to apply other KoolReport's processes to further process the JSON data.
Support CI/CD process
Since the popularity of CI/CD process, KoolReport library now fully support this new type of software integration and delivery processes. We understand the 1 hour token availability causes trouble for the automation delivery so we have increases the life time of token to maximum. In particular, the token will last until your subscription of KoolReport Pro is ended. If you have purchase the Perpetual Usage, the token expiration will be set the 2100-01-01 which is virtually life-time or never expired.
Support load balancing
If you are using load balancing with multiple servers containing app (with KoolReport integrated), the generated resource folders now have same name in all servers. So virtually, the client-side will be able to receive resource files regardless of servers it connects to.
D3Chart Client Events
The D3 chart has been upgraded with one of the most crucial features: client events. This is the missing part in D3 first version. Now all charts support itemSelect event which help you to track the click of user to item on the charts. Now D3 is able to work with DrillDown package to provide interactive drill down report.
DrillDown supports D3
Missing client events hindered the collaboration of DrillDown package with D3 chart. But not anymore, since the D3 package has supported the client events, the DrillDown package also support generate D3 Chart. By specifying the D3 chart as drilldown widgets, the DrillDown will bind itself to D3 itemSelect to provide interactive report.
Excel Package
We have fixed the PieChart display in Microsoft Excel and a minor bugs happened when data is missing.
ChartJS Package
We have upgraded the core of ChartJS to latest version of 2.9.x. With this new upgrade, some of known issues has been addressed. Furthermore, we have provided new plugins property which allows you to use most popular plugins for ChartJS like datalabels, annotation, stacked100 and others.
Inputs Package
Due to the upgrade of FontAwesome library in previous KoolReport's version, some of the icons have not been displayed correctly. This issue has been addressed in this new version of Inputs package.
New Yii2 Package
In this release, we roll out new package koolreport\yii2. As the name suggested, yii2 package will facilitate the integration of KoolReport with Yii2, one of the most used frameworks in PHP. Similar to other integration packages that we have created before like laravel or codeigniter, the yii2 package will help to auto configure report's assets settings and allow report to access to default database connection setup within Yii2.
Summary
The version 4.5.x added new features and empowered reporting capability to KoolReport. This upgrade is backward compatible with old 4.x versions so feel free to upgrade. If you need have any question about this new release, do not hesitate to let us know.
Thank you!
<3 koolreport team